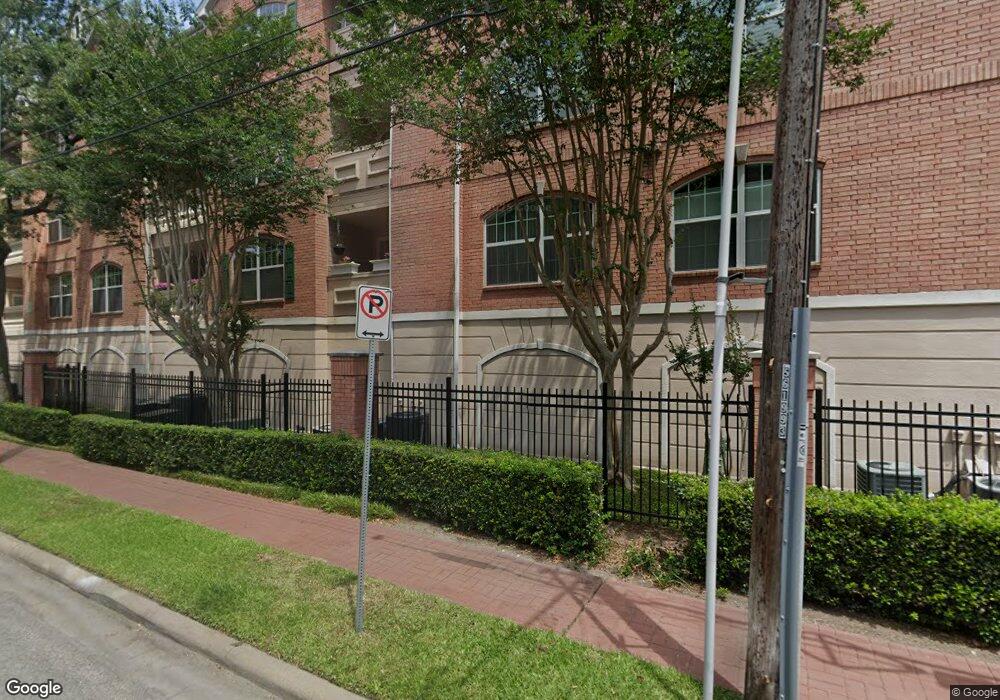
The Renaissance at River Oaks 2100 Welch St Unit C314 Houston, TX 77019
River Oaks NeighborhoodEstimated Value: $240,376 - $269,000
2
Beds
1
Bath
1,230
Sq Ft
$206/Sq Ft
Est. Value
About This Home
This home is located at 2100 Welch St Unit C314, Houston, TX 77019 and is currently estimated at $253,594, approximately $206 per square foot. 2100 Welch St Unit C314 is a home located in Harris County with nearby schools including River Oaks Elementary School, Lanier Middle School, and Lamar High School.
Ownership History
Date
Name
Owned For
Owner Type
Purchase Details
Closed on
Nov 2, 2015
Sold by
Ramirez Carlos E
Bought by
Dubey Utpala
Current Estimated Value
Purchase Details
Closed on
Mar 20, 2008
Sold by
Gmac Global Relocation Services Llc
Bought by
Ramirez Carlos E
Home Financials for this Owner
Home Financials are based on the most recent Mortgage that was taken out on this home.
Original Mortgage
$158,447
Interest Rate
6.11%
Mortgage Type
FHA
Purchase Details
Closed on
Feb 21, 2008
Sold by
Blane Nicola and Freeburg Hollis B
Bought by
Gmac Global Relocation Services Llc
Home Financials for this Owner
Home Financials are based on the most recent Mortgage that was taken out on this home.
Original Mortgage
$158,447
Interest Rate
6.11%
Mortgage Type
FHA
Purchase Details
Closed on
Jun 6, 2002
Sold by
The River Oaks Renaissance Llc
Bought by
Blane Nicola
Home Financials for this Owner
Home Financials are based on the most recent Mortgage that was taken out on this home.
Original Mortgage
$158,775
Interest Rate
6.89%
Create a Home Valuation Report for This Property
The Home Valuation Report is an in-depth analysis detailing your home's value as well as a comparison with similar homes in the area
Home Values in the Area
Average Home Value in this Area
Purchase History
| Date | Buyer | Sale Price | Title Company |
|---|---|---|---|
| Dubey Utpala | -- | Chicago Title | |
| Ramirez Carlos E | -- | First American Title | |
| Gmac Global Relocation Services Llc | -- | First American Title | |
| Blane Nicola | -- | Houston Title Co |
Source: Public Records
Mortgage History
| Date | Status | Borrower | Loan Amount |
|---|---|---|---|
| Previous Owner | Ramirez Carlos E | $158,447 | |
| Previous Owner | Blane Nicola | $158,775 |
Source: Public Records
Tax History Compared to Growth
Tax History
| Year | Tax Paid | Tax Assessment Tax Assessment Total Assessment is a certain percentage of the fair market value that is determined by local assessors to be the total taxable value of land and additions on the property. | Land | Improvement |
|---|---|---|---|---|
| 2025 | $4,874 | $232,741 | $44,221 | $188,520 |
| 2024 | $4,874 | $232,935 | $44,258 | $188,677 |
| 2023 | $4,874 | $266,095 | $50,558 | $215,537 |
| 2022 | $4,821 | $218,940 | $46,572 | $172,368 |
| 2021 | $5,622 | $241,219 | $45,832 | $195,387 |
| 2020 | $6,225 | $257,058 | $48,841 | $208,217 |
| 2019 | $6,194 | $244,760 | $46,504 | $198,256 |
| 2018 | $5,726 | $226,276 | $45,588 | $180,688 |
| 2017 | $5,722 | $226,276 | $45,588 | $180,688 |
| 2016 | $5,297 | $209,500 | $39,805 | $169,695 |
| 2015 | $5,059 | $225,700 | $46,837 | $178,863 |
| 2014 | $5,059 | $196,804 | $37,393 | $159,411 |
Source: Public Records
About The Renaissance at River Oaks
Map
Nearby Homes
- 2100 Welch St Unit C113
- 2100 Welch St Unit C212
- 2100 Welch St Unit C101
- 2111 Welch St Unit A321
- 2111 Welch St Unit A107
- 2111 Welch St Unit B220
- 1910 Huldy St Unit A
- 2026 Welch St
- 1915 Spann St
- 2027 Huldy St
- 1711 Huldy St Unit A
- 1909 Brun St Unit 17
- 2221 Welch St Unit 201
- 2221 Welch St Unit 401
- 2113 Huldy St
- 2115 Huldy St
- 2117 Huldy St
- 2119 Huldy St
- 2211 Avalon Place
- 2217 Pelham Dr
- 2100 Welch St Unit C201
- 2100 Welch St Unit C309
- 2100 Welch St Unit C111
- 2100 Welch St Unit C110
- 2100 Welch St Unit C109
- 2100 Welch St
- 2100 Welch St Unit C321
- 2100 Welch St Unit C320
- 2100 Welch St Unit C319
- 2100 Welch St Unit C318
- 2100 Welch St Unit C317
- 2100 Welch St Unit C316
- 2100 Welch St Unit C315
- 2100 Welch St Unit C312
- 2100 Welch St Unit C311
- 2100 Welch St Unit C310
- 2100 Welch St Unit C307
- 2100 Welch St Unit C306
- 2100 Welch St Unit C304
- 2100 Welch St Unit C303