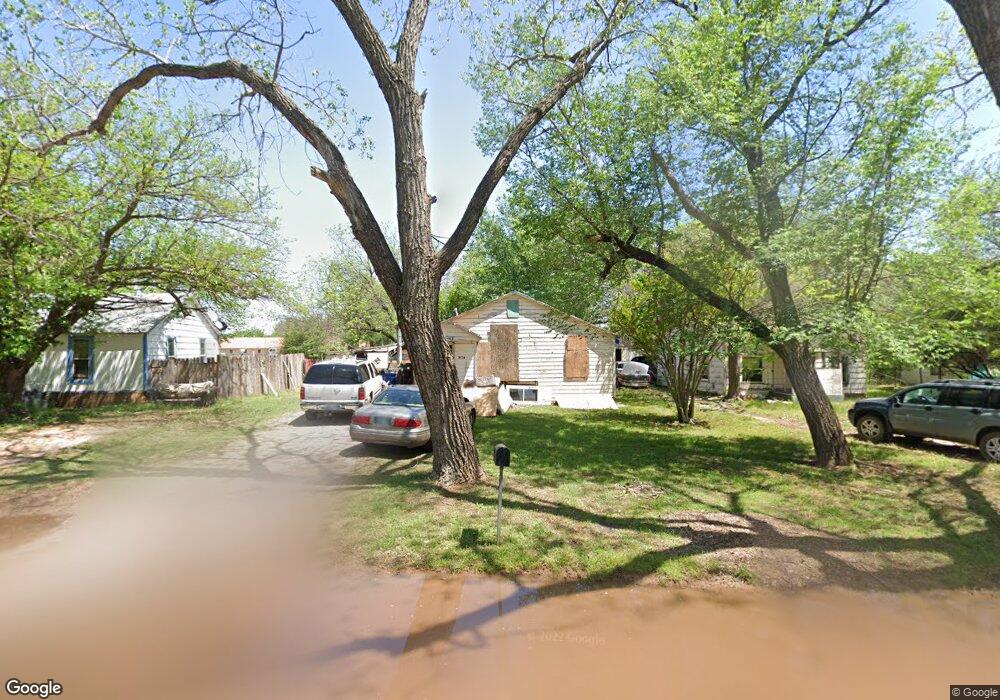
21001 N E St Duncan, OK 73533
Estimated Value: $46,221 - $92,000
2
Beds
1
Bath
870
Sq Ft
$80/Sq Ft
Est. Value
About This Home
This home is located at 21001 N E St, Duncan, OK 73533 and is currently estimated at $69,740, approximately $80 per square foot. 21001 N E St is a home with nearby schools including Woodrow Wilson Elementary School, Duncan Middle School, and Duncan High School.
Ownership History
Date
Name
Owned For
Owner Type
Purchase Details
Closed on
Oct 25, 2022
Sold by
Mccullough Jimmy
Bought by
Kaye Arbyckle Sandra
Current Estimated Value
Purchase Details
Closed on
Jan 26, 2009
Sold by
Mccullough Gale and Mccullough Linda
Bought by
Mccullough Jimmy and Mccullough Clesta S
Purchase Details
Closed on
Sep 29, 2008
Sold by
Mccullough Gale and Mccullough Linda
Bought by
Mccullough Jimmy and Mccullough Clesta S
Purchase Details
Closed on
Aug 22, 2005
Sold by
Mccullough Dale and Mccullough Linda
Bought by
Farr Candus
Purchase Details
Closed on
Jun 20, 1995
Sold by
Norton Loye E
Purchase Details
Closed on
Apr 2, 1993
Sold by
Norton Minnie Alta
Create a Home Valuation Report for This Property
The Home Valuation Report is an in-depth analysis detailing your home's value as well as a comparison with similar homes in the area
Purchase History
| Date | Buyer | Sale Price | Title Company |
|---|---|---|---|
| Kaye Arbyckle Sandra | -- | -- | |
| Mccullough Jimmy | $7,000 | None Available | |
| Mccullough Jimmy | $6,500 | None Available | |
| Farr Candus | $5,500 | None Available | |
| -- | -- | -- | |
| -- | -- | -- |
Source: Public Records
Tax History
| Year | Tax Paid | Tax Assessment Tax Assessment Total Assessment is a certain percentage of the fair market value that is determined by local assessors to be the total taxable value of land and additions on the property. | Land | Improvement |
|---|---|---|---|---|
| 2025 | $129 | $1,532 | $231 | $1,301 |
| 2024 | $118 | $1,390 | $231 | $1,159 |
| 2023 | $118 | $1,389 | $231 | $1,158 |
| 2022 | $107 | $1,260 | $231 | $1,029 |
| 2021 | $164 | $1,931 | $231 | $1,700 |
| 2020 | $151 | $1,752 | $231 | $1,521 |
| 2019 | $144 | $1,669 | $231 | $1,438 |
| 2018 | $149 | $1,735 | $231 | $1,504 |
| 2017 | $137 | $1,671 | $231 | $1,440 |
| 2016 | $129 | $1,516 | $231 | $1,285 |
| 2015 | $159 | $1,516 | $231 | $1,285 |
| 2014 | $159 | $1,845 | $138 | $1,707 |
Source: Public Records
Map
Nearby Homes
Your Personal Tour Guide
Ask me questions while you tour the home.