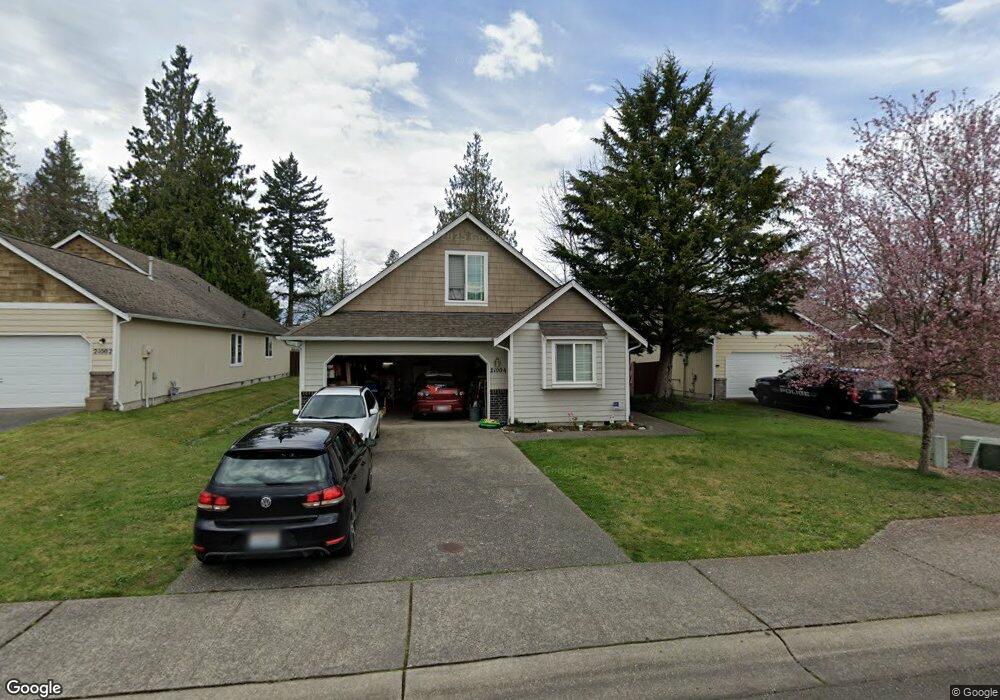
21004 76th St E Bonney Lake, WA 98391
Estimated Value: $591,720 - $645,000
3
Beds
3
Baths
2,068
Sq Ft
$303/Sq Ft
Est. Value
About This Home
This home is located at 21004 76th St E, Bonney Lake, WA 98391 and is currently estimated at $626,430, approximately $302 per square foot. 21004 76th St E is a home located in Pierce County with nearby schools including Mountain Meadow Elementary School, Glacier Middle School, and Kelly Lake Montessori.
Ownership History
Date
Name
Owned For
Owner Type
Purchase Details
Closed on
Jan 22, 2005
Sold by
Sound Built Homes Inc
Bought by
Racca Rentals Llc
Current Estimated Value
Home Financials for this Owner
Home Financials are based on the most recent Mortgage that was taken out on this home.
Original Mortgage
$156,500
Outstanding Balance
$78,962
Interest Rate
5.74%
Mortgage Type
Purchase Money Mortgage
Estimated Equity
$547,468
Purchase Details
Closed on
Jun 9, 2003
Sold by
Pettitt Llc
Bought by
Sunridge Homes Inc
Home Financials for this Owner
Home Financials are based on the most recent Mortgage that was taken out on this home.
Original Mortgage
$1,488,000
Interest Rate
5.61%
Mortgage Type
Purchase Money Mortgage
Purchase Details
Closed on
May 13, 2002
Sold by
Pacific Resource Development Inc
Bought by
Pettitt Llc
Create a Home Valuation Report for This Property
The Home Valuation Report is an in-depth analysis detailing your home's value as well as a comparison with similar homes in the area
Home Values in the Area
Average Home Value in this Area
Purchase History
| Date | Buyer | Sale Price | Title Company |
|---|---|---|---|
| Racca Rentals Llc | -- | First American Title Ins Co | |
| Sunridge Homes Inc | $650,000 | Chicago Title | |
| Pettitt Llc | -- | Chicago Title |
Source: Public Records
Mortgage History
| Date | Status | Borrower | Loan Amount |
|---|---|---|---|
| Open | Racca Rentals Llc | $156,500 | |
| Previous Owner | Sunridge Homes Inc | $1,488,000 |
Source: Public Records
Tax History Compared to Growth
Tax History
| Year | Tax Paid | Tax Assessment Tax Assessment Total Assessment is a certain percentage of the fair market value that is determined by local assessors to be the total taxable value of land and additions on the property. | Land | Improvement |
|---|---|---|---|---|
| 2025 | $4,862 | $525,200 | $182,900 | $342,300 |
| 2024 | $4,862 | $526,900 | $188,800 | $338,100 |
| 2023 | $4,862 | $488,800 | $175,100 | $313,700 |
| 2022 | $4,811 | $518,500 | $202,400 | $316,100 |
| 2021 | $4,650 | $372,100 | $132,000 | $240,100 |
| 2019 | $4,039 | $346,000 | $107,000 | $239,000 |
| 2018 | $4,145 | $330,200 | $100,200 | $230,000 |
| 2017 | $3,552 | $301,700 | $86,700 | $215,000 |
| 2016 | $3,528 | $231,400 | $61,200 | $170,200 |
| 2014 | $3,160 | $227,400 | $50,200 | $177,200 |
| 2013 | $3,160 | $189,400 | $42,600 | $146,800 |
Source: Public Records
Map
Nearby Homes
- 7704 211th Ave E
- 21205 Connells Prairie Rd E
- 20910 Church Lake Dr E
- 7223 Vandermark Rd E Unit 7225
- 7229 Vandermark Rd E Unit 7231
- 20506 80th St E
- 7010 Vandermark Rd E
- 20308 79th Street Ct E
- 20315 79th St E
- 7013 Vandermark Rd E
- 20221 Church Lake Rd E
- 21010 68th Street Ct E
- 7711 202nd Ave E
- 7715 202nd Ave E
- 8414 214th Ave E
- 8502 208th Avenue Ct E
- 21016 67th Street Ct E
- 21004 67th Street Ct E
- 21005 67th Street Ct E
- 21017 67th Street Ct E
- 21002 76th St E
- 21006 76th St E
- 20908 76th St E
- 21008 76th St E
- 7603 211th Ave E
- 21001 76th St E
- 20917 Church Lake Dr E
- 2010 76th St E
- 21010 76th St E
- 21001 Church Lake Dr E
- 20906 76th St E
- 7602 211th Ave E
- 7605 211th Ave E
- 20904 76th St E
- 20907 76th St E
- 7607 211th Ave E
- 7604 211th Ave E
- 7606 211th Ave E
- 21005 Church Lake Dr E
- 7611 211th Ave E