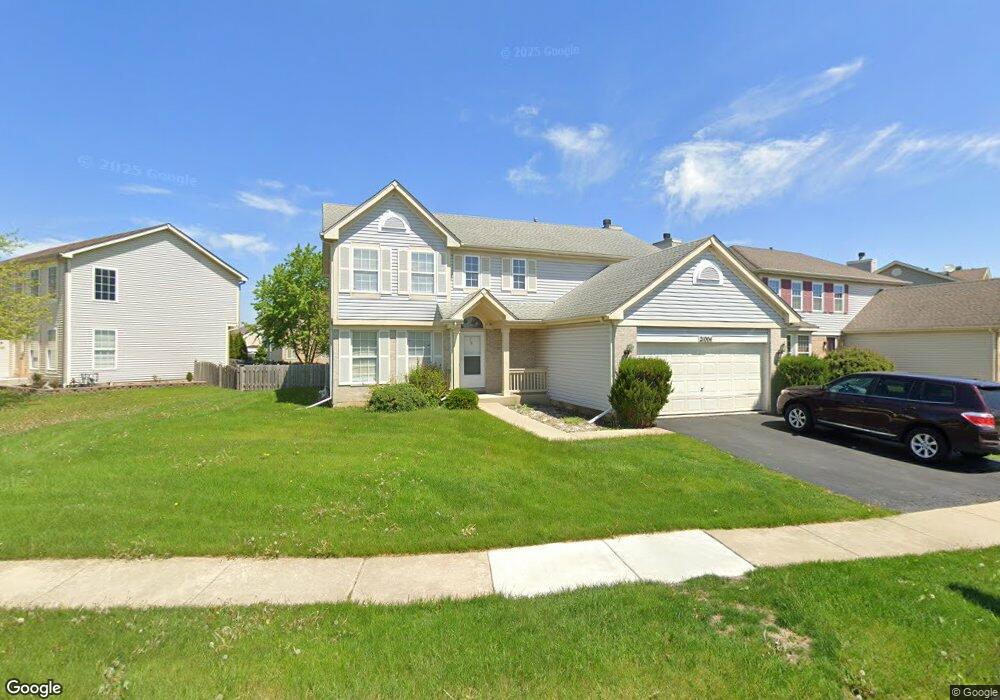
21004 W Bloomfield Dr Plainfield, IL 60544
Lakewood Falls NeighborhoodEstimated Value: $341,000 - $390,000
Studio
1
Bath
1,915
Sq Ft
$186/Sq Ft
Est. Value
About This Home
This home is located at 21004 W Bloomfield Dr, Plainfield, IL 60544 and is currently estimated at $356,427, approximately $186 per square foot. 21004 W Bloomfield Dr is a home located in Will County with nearby schools including Skoff Elementary School, A. Vito Martinez Middle School, and Romeoville High School.
Ownership History
Date
Name
Owned For
Owner Type
Purchase Details
Closed on
Nov 20, 2003
Sold by
Khawer Sohail
Bought by
Opoku Peter and Opoku Elizabeth
Current Estimated Value
Home Financials for this Owner
Home Financials are based on the most recent Mortgage that was taken out on this home.
Original Mortgage
$211,627
Outstanding Balance
$98,179
Interest Rate
6.01%
Mortgage Type
FHA
Estimated Equity
$258,248
Purchase Details
Closed on
May 30, 2001
Sold by
Vaccariello Anthony A and Vaccariello Kimberly A
Bought by
Khawer Sohail
Home Financials for this Owner
Home Financials are based on the most recent Mortgage that was taken out on this home.
Original Mortgage
$160,000
Interest Rate
7.18%
Purchase Details
Closed on
Jan 11, 1995
Sold by
Lakewood Falls Ltd Partnership Phase I
Bought by
Vaccariello Anthony A and Vaccariello Kimberly A
Home Financials for this Owner
Home Financials are based on the most recent Mortgage that was taken out on this home.
Original Mortgage
$148,500
Interest Rate
7.5%
Mortgage Type
Purchase Money Mortgage
Create a Home Valuation Report for This Property
The Home Valuation Report is an in-depth analysis detailing your home's value as well as a comparison with similar homes in the area
Home Values in the Area
Average Home Value in this Area
Purchase History
| Date | Buyer | Sale Price | Title Company |
|---|---|---|---|
| Opoku Peter | $215,000 | Multiple | |
| Khawer Sohail | $200,000 | -- | |
| Vaccariello Anthony A | $168,000 | Chicago Title Insurance Co |
Source: Public Records
Mortgage History
| Date | Status | Borrower | Loan Amount |
|---|---|---|---|
| Open | Opoku Peter | $211,627 | |
| Previous Owner | Khawer Sohail | $160,000 | |
| Previous Owner | Vaccariello Anthony A | $148,500 |
Source: Public Records
Tax History
| Year | Tax Paid | Tax Assessment Tax Assessment Total Assessment is a certain percentage of the fair market value that is determined by local assessors to be the total taxable value of land and additions on the property. | Land | Improvement |
|---|---|---|---|---|
| 2024 | $10,004 | $115,892 | $26,592 | $89,300 |
| 2023 | $10,004 | $104,042 | $23,873 | $80,169 |
| 2022 | $8,763 | $94,207 | $21,617 | $72,590 |
| 2021 | $8,361 | $88,532 | $20,315 | $68,217 |
| 2020 | $8,142 | $85,621 | $19,647 | $65,974 |
| 2019 | $7,719 | $81,158 | $18,623 | $62,535 |
| 2018 | $7,419 | $77,241 | $17,724 | $59,517 |
| 2017 | $6,986 | $72,917 | $16,732 | $56,185 |
| 2016 | $6,608 | $68,338 | $15,681 | $52,657 |
| 2015 | $5,649 | $61,341 | $14,075 | $47,266 |
| 2014 | $5,649 | $56,797 | $13,032 | $43,765 |
| 2013 | $5,649 | $59,164 | $13,575 | $45,589 |
Source: Public Records
Map
Nearby Homes
- 55 Harmony Ln
- 0 S Weber Rd
- 1466 Larkspur Ct
- 14064 Denton Ct
- 1489 Windflower Ct
- 138 Mountain Laurel Ct
- 21238 Edison Ln
- 142 Mountain Laurel Ct Unit 2
- 13931 S Bristlecone Dr Unit A
- 13810 S Magnolia Dr
- 191 Mountain Laurel Ct
- 142 Azalea Cir Unit 713
- 13825 S Bristlecone Ln Unit C
- 21050 W Aspen Ln
- 21056 W Aspen Ln
- 1517 Azalea Cir Unit 679
- 1565 Azalea Cir Unit 694
- 21459 W Georgetown Dr
- 21506 Franklin Cir
- 1594 Baytree Dr
- 20962 W Bloomfield Dr
- 21012 W Bloomfield Dr
- 21005 W Boulder Dr
- 20956 W Bloomfield Dr
- 20965 W Boulder Dr
- 21018 W Bloomfield Dr
- 20959 W Boulder Dr
- 21001 W Bloomfield Dr
- 21017 W Bloomfield Dr
- 21015 W Bloomfield Dr
- 21019 W Bloomfield Dr
- 20949 W Barrington Ln
- 20953 W Boulder Dr
- 21005 W Bloomfield Dr
- 21013 W Bloomfield Dr
- 21023 W Bloomfield Dr
- 20944 W Bloomfield Dr
- 21009 W Bloomfield Dr
- 20947 W Barrington Ln Unit 1
- 14160 S Butler Ct
Your Personal Tour Guide
Ask me questions while you tour the home.