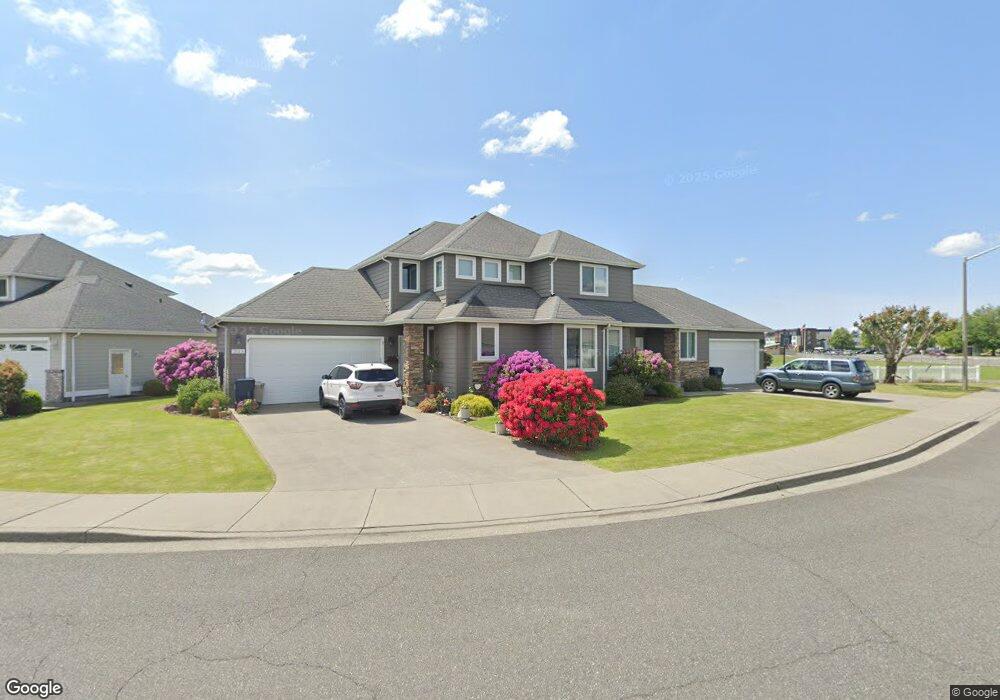
2101 Bender Park Blvd Unit 6 Lynden, WA 98264
Estimated Value: $660,000 - $879,000
4
Beds
3
Baths
3,205
Sq Ft
$235/Sq Ft
Est. Value
About This Home
This home is located at 2101 Bender Park Blvd Unit 6, Lynden, WA 98264 and is currently estimated at $753,327, approximately $235 per square foot. 2101 Bender Park Blvd Unit 6 is a home located in Whatcom County with nearby schools including Lynden High School, Lynden Christian School, and Lynden Christian Schools: Administration.
Ownership History
Date
Name
Owned For
Owner Type
Purchase Details
Closed on
Sep 27, 2022
Sold by
Starkenburg Ronald
Bought by
Blair Diane E and Blair Andrew F
Current Estimated Value
Home Financials for this Owner
Home Financials are based on the most recent Mortgage that was taken out on this home.
Original Mortgage
$275,000
Outstanding Balance
$264,594
Interest Rate
6.02%
Mortgage Type
New Conventional
Estimated Equity
$488,733
Purchase Details
Closed on
Feb 3, 2006
Sold by
White Steven William
Bought by
Starkenburg Ronald and Starkenburg Ruth
Purchase Details
Closed on
Sep 11, 2003
Sold by
Rb Development
Bought by
White Steven William
Home Financials for this Owner
Home Financials are based on the most recent Mortgage that was taken out on this home.
Original Mortgage
$256,000
Interest Rate
5.25%
Mortgage Type
Purchase Money Mortgage
Create a Home Valuation Report for This Property
The Home Valuation Report is an in-depth analysis detailing your home's value as well as a comparison with similar homes in the area
Home Values in the Area
Average Home Value in this Area
Purchase History
| Date | Buyer | Sale Price | Title Company |
|---|---|---|---|
| Blair Diane E | -- | Chicago Title | |
| Starkenburg Ronald | $447,780 | Chicago Title Insurance | |
| White Steven William | $342,000 | Chicago Title Insurance |
Source: Public Records
Mortgage History
| Date | Status | Borrower | Loan Amount |
|---|---|---|---|
| Open | Blair Diane E | $275,000 | |
| Previous Owner | White Steven William | $256,000 | |
| Closed | White Steven William | $50,000 |
Source: Public Records
Tax History Compared to Growth
Tax History
| Year | Tax Paid | Tax Assessment Tax Assessment Total Assessment is a certain percentage of the fair market value that is determined by local assessors to be the total taxable value of land and additions on the property. | Land | Improvement |
|---|---|---|---|---|
| 2024 | $6,599 | $830,000 | $150,000 | $680,000 |
| 2023 | $6,599 | $830,000 | $150,000 | $680,000 |
| 2022 | $5,658 | $694,043 | $155,916 | $538,127 |
| 2021 | $5,650 | $614,198 | $137,979 | $476,219 |
| 2020 | $5,115 | $558,351 | $125,433 | $432,918 |
| 2019 | $4,536 | $529,226 | $118,890 | $410,336 |
| 2018 | $4,756 | $481,151 | $108,090 | $373,061 |
| 2017 | $4,043 | $414,246 | $93,060 | $321,186 |
| 2016 | $3,925 | $374,569 | $96,660 | $277,909 |
| 2015 | $3,345 | $361,731 | $92,880 | $268,851 |
| 2014 | -- | $335,995 | $86,310 | $249,685 |
| 2013 | -- | $332,297 | $85,500 | $246,797 |
Source: Public Records
Map
Nearby Homes
- 1112 N Cascade Ct
- 2201 Dejong Dr
- 2205 Dejong Dr
- 1136 N Cascade Ct
- 9586 Bender Rd
- 114 Twin Sister Loop
- 1660 Eastwood Way
- 8639 Bender Rd
- 1251 Garden Cir
- 8885 Line Rd
- 1319 Bradley Ct
- 1402 Bradley Meadows Ln
- 8844 Depot Rd Unit B204
- 8872 Depot Rd Unit 203
- 1725 Aaron Dr
- 107 Springview Dr
- 2202 Berryman Loop
- 137 E Cedar Dr
- 8780 Depot Rd Unit 207
- 8780 Depot Rd Unit 308
- 2073 Bender Park Blvd
- 2174 Bender Park Blvd
- 2055 Bender Park Blvd
- 2102 Bender Park Blvd Unit A
- 2102 Bender Park Blvd
- 2156 Bender Park Blvd Unit A & B
- 2156 Bender Park Blvd Unit 2
- 2072 Bender Park Blvd Unit 7
- 2054 Bender Park Blvd Unit A
- 2054 Bender Park Blvd Unit 8
- 2054 Bender Park Blvd Unit B
- 2120 Bender Park Blvd
- 2138 Bender Park Blvd Unit 3
- 2037 Bender Park Blvd Unit 8th
- 2037 Bender Park Blvd Unit B
- 2037 Bender Park Blvd Unit A
- 2037 Bender Park Blvd Unit 14
- 2036 Bender Park Blvd Unit B
- 2036 Bender Park Blvd Unit A
- 2036 Bender Park Blvd Unit 2