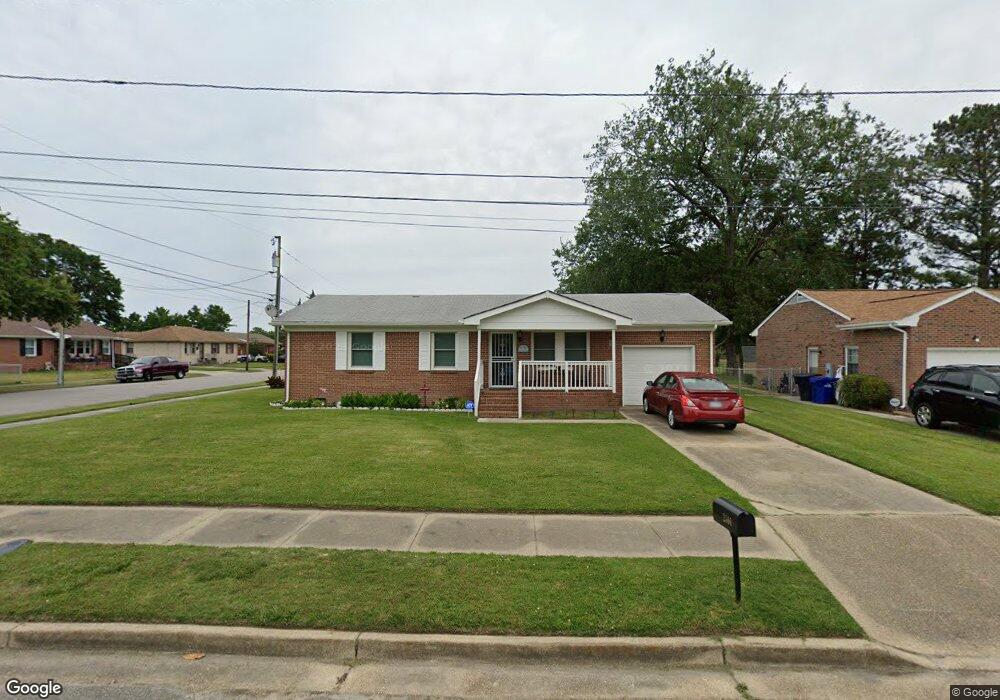
2101 Green St Portsmouth, VA 23704
South Portsmouth NeighborhoodEstimated Value: $245,928 - $261,000
3
Beds
2
Baths
975
Sq Ft
$260/Sq Ft
Est. Value
About This Home
This home is located at 2101 Green St, Portsmouth, VA 23704 and is currently estimated at $253,732, approximately $260 per square foot. 2101 Green St is a home located in Portsmouth City with nearby schools including Brighton Elementary School, Manor High School, and Court Street Academy.
Ownership History
Date
Name
Owned For
Owner Type
Purchase Details
Closed on
Aug 12, 2021
Sold by
Dominion Property Ventures Llc
Bought by
Perry Alvin and Perry Charlotte
Current Estimated Value
Home Financials for this Owner
Home Financials are based on the most recent Mortgage that was taken out on this home.
Original Mortgage
$213,624
Outstanding Balance
$193,831
Interest Rate
2.9%
Mortgage Type
FHA
Estimated Equity
$59,901
Purchase Details
Closed on
Oct 27, 2020
Sold by
Atlantic Trustee Services Llc
Bought by
Dominion Property Ventures Llc
Home Financials for this Owner
Home Financials are based on the most recent Mortgage that was taken out on this home.
Original Mortgage
$125,000
Interest Rate
2.8%
Mortgage Type
New Conventional
Purchase Details
Closed on
Aug 20, 2008
Sold by
Peebles Joyce P
Bought by
Epps Marguerite
Home Financials for this Owner
Home Financials are based on the most recent Mortgage that was taken out on this home.
Original Mortgage
$145,000
Interest Rate
6.54%
Mortgage Type
VA
Create a Home Valuation Report for This Property
The Home Valuation Report is an in-depth analysis detailing your home's value as well as a comparison with similar homes in the area
Home Values in the Area
Average Home Value in this Area
Purchase History
| Date | Buyer | Sale Price | Title Company |
|---|---|---|---|
| Perry Alvin | $221,000 | Attorney | |
| Dominion Property Ventures Llc | $68,000 | None Available | |
| Epps Marguerite | $145,000 | -- |
Source: Public Records
Mortgage History
| Date | Status | Borrower | Loan Amount |
|---|---|---|---|
| Open | Perry Alvin | $213,624 | |
| Previous Owner | Dominion Property Ventures Llc | $125,000 | |
| Previous Owner | Epps Marguerite | $145,000 |
Source: Public Records
Tax History Compared to Growth
Tax History
| Year | Tax Paid | Tax Assessment Tax Assessment Total Assessment is a certain percentage of the fair market value that is determined by local assessors to be the total taxable value of land and additions on the property. | Land | Improvement |
|---|---|---|---|---|
| 2025 | $2,738 | $220,300 | $62,500 | $157,800 |
| 2024 | $2,738 | $208,660 | $62,500 | $146,160 |
| 2023 | $2,883 | $230,650 | $62,500 | $168,150 |
| 2022 | $2,836 | $218,150 | $50,000 | $168,150 |
| 2021 | $1,687 | $129,740 | $35,650 | $94,090 |
| 2020 | $1,585 | $121,900 | $33,950 | $87,950 |
| 2019 | $1,571 | $120,880 | $33,950 | $86,930 |
| 2018 | $1,571 | $120,880 | $33,950 | $86,930 |
| 2017 | $1,571 | $120,880 | $33,950 | $86,930 |
| 2016 | $1,571 | $120,880 | $33,950 | $86,930 |
| 2015 | $1,571 | $120,880 | $33,950 | $86,930 |
| 2014 | $1,535 | $120,880 | $33,950 | $86,930 |
Source: Public Records
Map
Nearby Homes
- 2000 Effingham St
- 2316 Effingham St
- 101 Gilmerton Ave
- 1906 Lasalle Ave
- 2409 Peach St
- 2411 Peach St
- 2107 Pearl St
- 2111 Pearl St
- 572 Portsmouth Blvd
- 2124 Pearl St
- 2516 Peach St
- 1918 Prentis Ave
- 1121 Fayette St
- 1623 Prentis Ave
- 2008 Elm Ave
- 1438 Lasalle Ave
- 1908 Elm Ave
- 1621 Elm Ave
- 1919 Camden Ave
- 1520 Prentis Ave