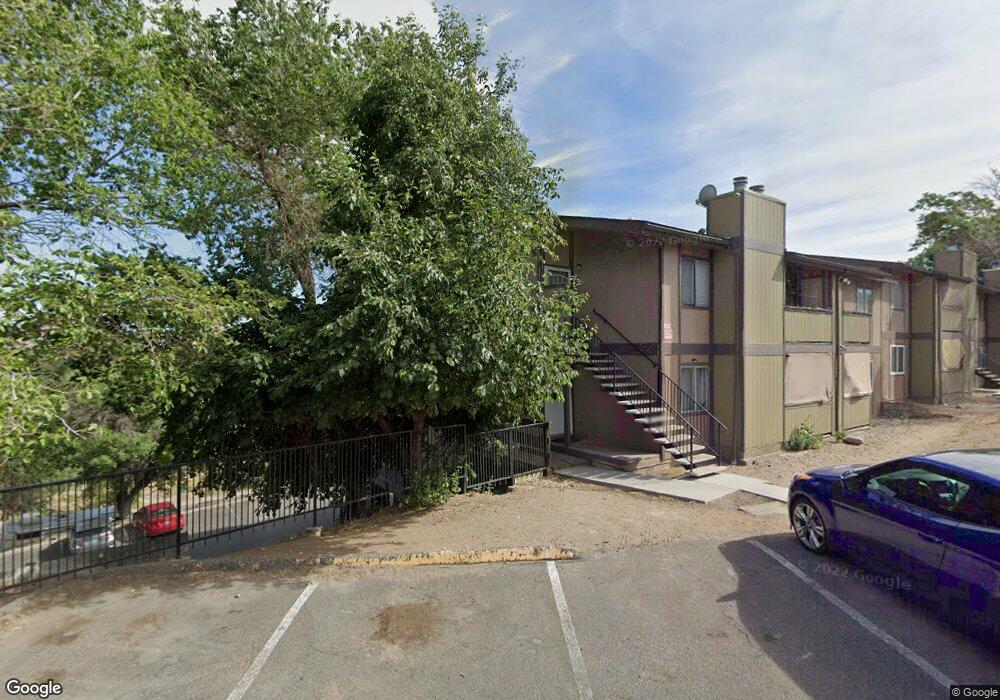
2101 Highview Ct Unit B9L Reno, NV 89512
Northeast Reno NeighborhoodEstimated Value: $163,000 - $224,983
3
Beds
2
Baths
1,165
Sq Ft
$173/Sq Ft
Est. Value
About This Home
This home is located at 2101 Highview Ct Unit B9L, Reno, NV 89512 and is currently estimated at $200,996, approximately $172 per square foot. 2101 Highview Ct Unit B9L is a home located in Washoe County with nearby schools including Rita Cannan Elementary School, Fred W. Traner Middle School, and Procter R. Hug High School.
Ownership History
Date
Name
Owned For
Owner Type
Purchase Details
Closed on
Jun 19, 2007
Sold by
Tobon Maria G
Bought by
Luna Pedro and Luna Maria
Current Estimated Value
Home Financials for this Owner
Home Financials are based on the most recent Mortgage that was taken out on this home.
Original Mortgage
$75,000
Outstanding Balance
$50,653
Interest Rate
8.2%
Mortgage Type
Balloon
Estimated Equity
$150,343
Purchase Details
Closed on
May 29, 1997
Sold by
Tobon Rene
Bought by
Tobon Maria G
Home Financials for this Owner
Home Financials are based on the most recent Mortgage that was taken out on this home.
Original Mortgage
$46,800
Interest Rate
8.13%
Purchase Details
Closed on
May 28, 1997
Sold by
Buschine Glenn M and Buschine Stacey
Bought by
Tobon Maria G
Home Financials for this Owner
Home Financials are based on the most recent Mortgage that was taken out on this home.
Original Mortgage
$46,800
Interest Rate
8.13%
Create a Home Valuation Report for This Property
The Home Valuation Report is an in-depth analysis detailing your home's value as well as a comparison with similar homes in the area
Home Values in the Area
Average Home Value in this Area
Purchase History
| Date | Buyer | Sale Price | Title Company |
|---|---|---|---|
| Luna Pedro | $75,000 | First American Title | |
| Tobon Maria G | -- | Stewart Title | |
| Tobon Maria G | $52,000 | Stewart Title Company |
Source: Public Records
Mortgage History
| Date | Status | Borrower | Loan Amount |
|---|---|---|---|
| Open | Luna Pedro | $75,000 | |
| Previous Owner | Tobon Maria G | $46,800 |
Source: Public Records
Tax History Compared to Growth
Tax History
| Year | Tax Paid | Tax Assessment Tax Assessment Total Assessment is a certain percentage of the fair market value that is determined by local assessors to be the total taxable value of land and additions on the property. | Land | Improvement |
|---|---|---|---|---|
| 2025 | $335 | $33,285 | $14,700 | $18,585 |
| 2024 | $335 | $34,246 | $14,700 | $19,546 |
| 2023 | $326 | $31,791 | $14,245 | $17,546 |
| 2022 | $316 | $25,489 | $10,185 | $15,304 |
| 2021 | $294 | $22,912 | $7,385 | $15,527 |
| 2020 | $276 | $22,762 | $6,930 | $15,832 |
| 2019 | $263 | $22,899 | $7,420 | $15,479 |
| 2018 | $248 | $18,071 | $2,765 | $15,306 |
| 2017 | $241 | $18,773 | $3,430 | $15,343 |
| 2016 | $235 | $13,422 | $2,310 | $11,112 |
| 2015 | $235 | $9,209 | $2,135 | $7,074 |
| 2014 | $228 | $8,026 | $1,855 | $6,171 |
| 2013 | -- | $6,455 | $1,015 | $5,440 |
Source: Public Records
Map
Nearby Homes
- 2101 Highview Ct Unit 9
- 2500 Tripp Dr Unit 4
- 2065 Wedekind Rd
- 2090 Highview Ct Unit 7
- 2375 Tripp Dr Unit 11
- 2375 Tripp Dr Unit 9
- 2355 Tripp Dr Unit 7
- 2085 Highview Ct Unit 2
- 1955 Wilder St
- 2555 Clear Acre Ln Unit 13
- 2555 Clear Acre Ln Unit 29-2
- 2555 Clear Acre Ln Unit 32
- 2555 Clear Acre Ln Unit 9-3
- 2555 Clear Acre Ln Unit 93-3
- 2424 Sutro St
- 1925 Citron St
- 1868 Fife Dr
- 1895 Citron St
- 1855 Mccloud Ave
- 2730 Dahlia Way
- 2101 Highview Ct Unit 19
- 2101 Highview Ct Unit 11
- 2101 Highview Ct Unit 7
- 2101 Highview Ct Unit 6
- 2101 Highview Ct Unit 15
- 2101 Highview Ct Unit 4
- 2101 Highview Ct Unit A1L
- 2101 Highview Ct Unit A41
- 2101 Highview Ct Unit A3L
- 2101 Highview Ct Unit A6L
- 2101 Highview Ct Unit A5L
- 2101 Highview Ct Unit A8L
- 2101 Highview Ct Unit A7L
- 2101 Highview Ct
- 2101 Highview Ct Unit A2U
- 2101 Highview Ct Unit A1U
- 2101 Highview Ct Unit A4U
- 2101 Highview Ct Unit A3U
- 2101 Highview Ct Unit A6U
- 2101 Highview Ct Unit A5U