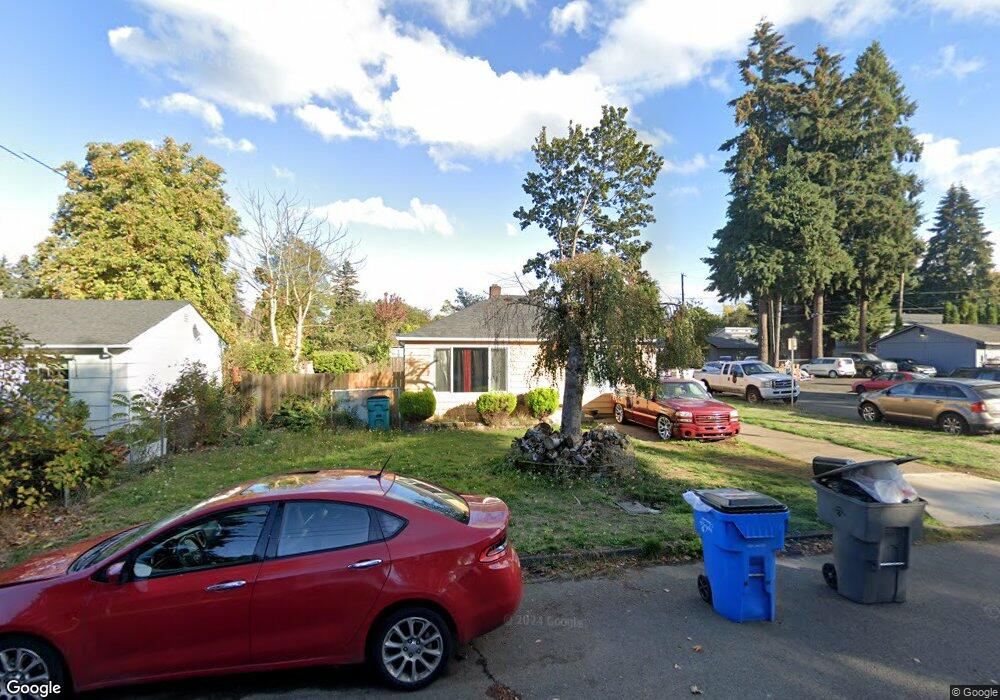
2101 Laurel Place Vancouver, WA 98661
Harney Heights NeighborhoodEstimated Value: $330,000 - $370,747
2
Beds
1
Bath
795
Sq Ft
$441/Sq Ft
Est. Value
About This Home
This home is located at 2101 Laurel Place, Vancouver, WA 98661 and is currently estimated at $350,437, approximately $440 per square foot. 2101 Laurel Place is a home located in Clark County with nearby schools including Martin Luther King Elementary School, McLoughlin Middle School, and Fort Vancouver High School.
Ownership History
Date
Name
Owned For
Owner Type
Purchase Details
Closed on
Jul 10, 2018
Sold by
Bains Balraj Kaur
Bought by
Bains Harkanwal
Current Estimated Value
Home Financials for this Owner
Home Financials are based on the most recent Mortgage that was taken out on this home.
Original Mortgage
$114,375
Outstanding Balance
$99,123
Interest Rate
4.5%
Mortgage Type
New Conventional
Estimated Equity
$251,314
Purchase Details
Closed on
May 26, 2015
Sold by
Madsen Josh and Madsen Mary Jane
Bought by
Meeker Mary
Home Financials for this Owner
Home Financials are based on the most recent Mortgage that was taken out on this home.
Original Mortgage
$115,000
Interest Rate
3.64%
Mortgage Type
Seller Take Back
Purchase Details
Closed on
Aug 24, 2004
Sold by
Rew Truman L and Rew Donna
Bought by
Madsen Josh and Madsen Mary Jane
Home Financials for this Owner
Home Financials are based on the most recent Mortgage that was taken out on this home.
Original Mortgage
$124,000
Interest Rate
6.11%
Mortgage Type
Purchase Money Mortgage
Create a Home Valuation Report for This Property
The Home Valuation Report is an in-depth analysis detailing your home's value as well as a comparison with similar homes in the area
Home Values in the Area
Average Home Value in this Area
Purchase History
| Date | Buyer | Sale Price | Title Company |
|---|---|---|---|
| Bains Harkanwal | -- | Fidelity National Title Vanc | |
| Bains Harkanwal | $152,500 | Fidelity National Title Vanc | |
| Meeker Mary | $115,000 | Cascade Title Company | |
| Chapman Sam | $135,000 | Cascade Title Company | |
| Madsen Josh | $115,000 | First American Title |
Source: Public Records
Mortgage History
| Date | Status | Borrower | Loan Amount |
|---|---|---|---|
| Open | Bains Harkanwal | $114,375 | |
| Previous Owner | Chapman Sam | $115,000 | |
| Previous Owner | Madsen Josh | $124,000 |
Source: Public Records
Tax History Compared to Growth
Tax History
| Year | Tax Paid | Tax Assessment Tax Assessment Total Assessment is a certain percentage of the fair market value that is determined by local assessors to be the total taxable value of land and additions on the property. | Land | Improvement |
|---|---|---|---|---|
| 2025 | $3,118 | $326,689 | $174,416 | $152,273 |
| 2024 | $3,079 | $319,002 | $174,416 | $144,586 |
| 2023 | $2,950 | $337,292 | $182,344 | $154,948 |
| 2022 | $2,830 | $316,270 | $177,587 | $138,683 |
| 2021 | $2,739 | $282,755 | $158,560 | $124,195 |
| 2020 | $2,455 | $257,966 | $138,204 | $119,762 |
| 2019 | $2,134 | $239,569 | $119,777 | $119,792 |
| 2018 | $2,168 | $215,680 | $0 | $0 |
| 2017 | $1,875 | $181,912 | $0 | $0 |
| 2016 | $1,811 | $164,161 | $0 | $0 |
| 2015 | -- | $151,492 | $0 | $0 |
| 2014 | -- | $130,049 | $0 | $0 |
| 2013 | -- | $107,584 | $0 | $0 |
Source: Public Records
Map
Nearby Homes
- 3306 E 17th St
- 3313 E 17th St
- 1511 June Dr
- 1515 June Dr
- 1533 Cellars Ave
- 2809 E 24th St
- 13 Algona Dr
- 1618 Brandt Rd
- 1620 Brandt Rd
- 2727 Rossiter Ln
- 3909 E 4th Plain Blvd Unit 47
- 3909 E Fourth Plain Blvd Unit 4
- 2772 E Mcloughlin Blvd
- 3903 E 18th St
- 3903 E 18th St Unit 22
- 1414 Brandt Rd Unit D30
- 1414 Brandt Rd Unit F42
- 1414 Brandt Rd Unit B17
- 2611 E 26th St
- 1418 Grand Place
- 2105 Laurel Place
- 3322 E 21st St
- 2111 Laurel Place
- 3324 E 21st St
- 2108 Laurel Place
- 3400 E 21st St
- 2105 Neals Ln
- 3323 E 21st St
- 2110 Laurel Place
- 2000 Laurel Place
- 3401 E 21st St Unit 7
- 3405 E 21st St
- 3404 E 21st St
- 3415 E 21st St
- 3312 E 4th Plain Blvd
- 3430 E 21st St
- 2103 Norris Rd Unit A
- 2103 Norris Rd
- 2009 Norris Rd Unit 4
- 2009 Norris Rd