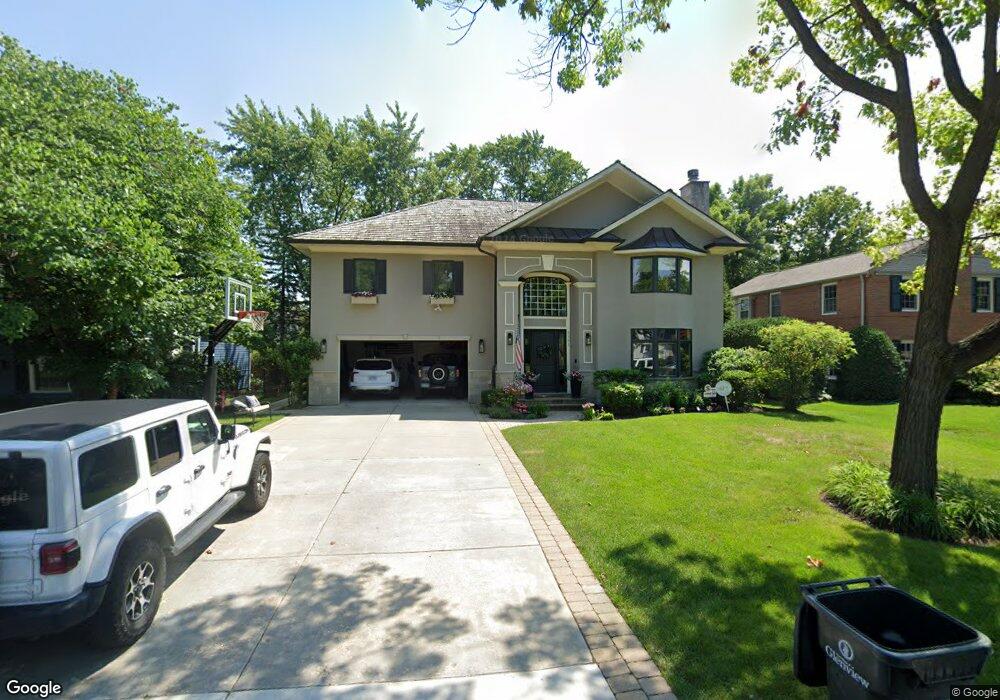
2101 Linneman St Glenview, IL 60025
Estimated Value: $1,254,041 - $1,819,000
5
Beds
5
Baths
3,197
Sq Ft
$464/Sq Ft
Est. Value
About This Home
This home is located at 2101 Linneman St, Glenview, IL 60025 and is currently estimated at $1,484,510, approximately $464 per square foot. 2101 Linneman St is a home located in Cook County with nearby schools including Hoffman Elementary School, Henking Elementary School, and Springman Middle School.
Ownership History
Date
Name
Owned For
Owner Type
Purchase Details
Closed on
Sep 25, 2009
Sold by
Dezel Peter
Bought by
Browe Brody J and Browe Jennifer E
Current Estimated Value
Home Financials for this Owner
Home Financials are based on the most recent Mortgage that was taken out on this home.
Original Mortgage
$789,600
Outstanding Balance
$508,225
Interest Rate
5.12%
Mortgage Type
New Conventional
Estimated Equity
$976,285
Purchase Details
Closed on
Oct 24, 2006
Sold by
Bates Kevin and Bates Jennifer
Bought by
Dezell Peter
Home Financials for this Owner
Home Financials are based on the most recent Mortgage that was taken out on this home.
Original Mortgage
$449,600
Interest Rate
6.5%
Mortgage Type
Unknown
Purchase Details
Closed on
Oct 15, 1998
Sold by
Wilen Deborah J
Bought by
Bates Kevin and Bates Jennifer
Home Financials for this Owner
Home Financials are based on the most recent Mortgage that was taken out on this home.
Original Mortgage
$283,500
Interest Rate
6.88%
Purchase Details
Closed on
Feb 24, 1993
Sold by
Wilen John K and Wilen Deborah J
Bought by
Wilen Deborah J
Create a Home Valuation Report for This Property
The Home Valuation Report is an in-depth analysis detailing your home's value as well as a comparison with similar homes in the area
Home Values in the Area
Average Home Value in this Area
Purchase History
| Date | Buyer | Sale Price | Title Company |
|---|---|---|---|
| Browe Brody J | $987,000 | Chicago Title Insurance Co | |
| Browe Brody J | $987,000 | Chicago Title Insurance Co | |
| Dezell Peter | $562,000 | Chicago Title Insurance Co | |
| Bates Kevin | $275,000 | First American Title | |
| Wilen Deborah J | -- | -- |
Source: Public Records
Mortgage History
| Date | Status | Borrower | Loan Amount |
|---|---|---|---|
| Open | Browe Brody J | $789,600 | |
| Closed | Browe Brody J | $789,600 | |
| Previous Owner | Dezell Peter | $449,600 | |
| Previous Owner | Bates Kevin | $283,500 |
Source: Public Records
Tax History
| Year | Tax Paid | Tax Assessment Tax Assessment Total Assessment is a certain percentage of the fair market value that is determined by local assessors to be the total taxable value of land and additions on the property. | Land | Improvement |
|---|---|---|---|---|
| 2025 | $14,787 | $117,740 | $17,784 | $99,956 |
| 2024 | $14,787 | $62,228 | $14,976 | $47,252 |
| 2023 | $19,065 | $70,124 | $14,976 | $55,148 |
| 2022 | $19,065 | $92,056 | $14,976 | $77,080 |
| 2021 | $19,874 | $83,179 | $11,466 | $71,713 |
| 2020 | $19,694 | $83,179 | $11,466 | $71,713 |
| 2019 | $20,619 | $102,283 | $11,466 | $90,817 |
| 2018 | $15,355 | $70,198 | $10,062 | $60,136 |
| 2017 | $16,383 | $76,560 | $10,062 | $66,498 |
| 2016 | $17,042 | $83,062 | $10,062 | $73,000 |
| 2015 | $15,462 | $67,553 | $8,190 | $59,363 |
| 2014 | $15,192 | $67,553 | $8,190 | $59,363 |
| 2013 | $14,715 | $67,553 | $8,190 | $59,363 |
Source: Public Records
Map
Nearby Homes
- 2029 Linneman St
- 2105 Linneman St
- 2100 Larkdale Dr Unit 3
- 2025 Linneman St
- 2111 Linneman St
- 2028 Larkdale Dr
- 2108 Larkdale Dr
- 2022 Larkdale Dr
- 2019 Linneman St
- 2117 Linneman St
- 2116 Larkdale Dr
- 800 Elm St
- 2018 Larkdale Dr
- 2028 Linneman St
- 2108 Linneman St
- 2013 Linneman St
- 2120 Larkdale Dr
- 2022 Linneman St
- 2116 Linneman St