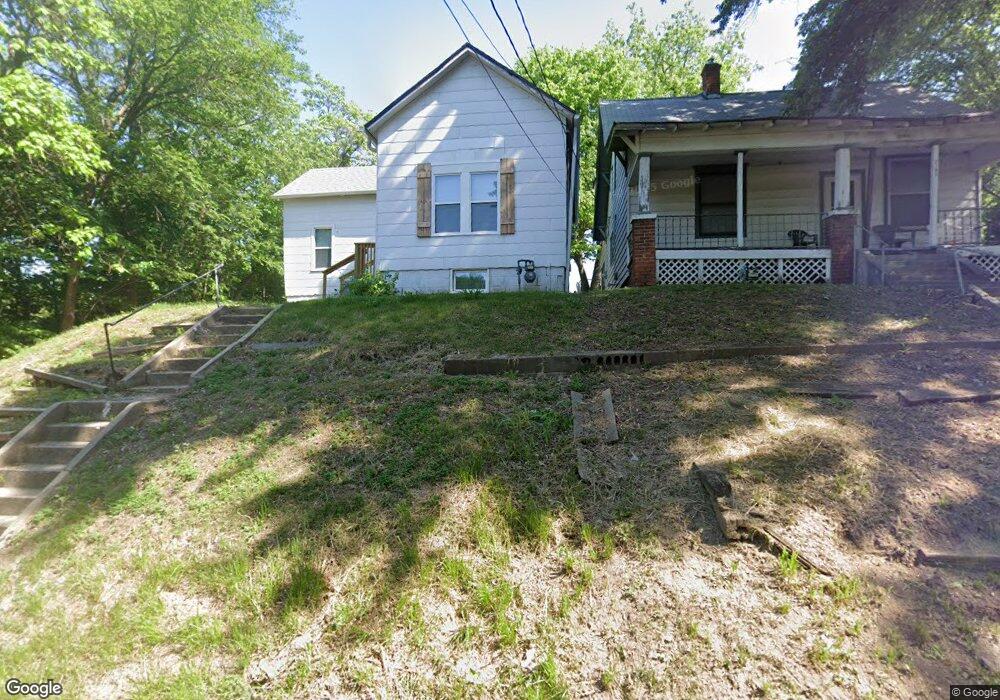
2101 Pear St Saint Joseph, MO 64503
Southside NeighborhoodEstimated Value: $87,000
--
Bed
--
Bath
816
Sq Ft
$107/Sq Ft
Est. Value
About This Home
This home is located at 2101 Pear St, Saint Joseph, MO 64503 and is currently estimated at $87,000, approximately $106 per square foot. 2101 Pear St is a home located in Buchanan County with nearby schools including Hyde Elementary School, Truman Middle School, and Central High School.
Ownership History
Date
Name
Owned For
Owner Type
Purchase Details
Closed on
May 10, 2024
Sold by
Newine Llc
Bought by
Josiah Holdings Llc
Current Estimated Value
Purchase Details
Closed on
Nov 26, 2023
Sold by
Collins Chad
Bought by
Newline Llc
Purchase Details
Closed on
Jan 27, 2022
Sold by
Jonathan Barnett
Bought by
Collins Chad
Purchase Details
Closed on
Sep 21, 2019
Sold by
Barnett Jacqueline
Bought by
Barnett Jonathan
Purchase Details
Closed on
Jul 5, 2018
Sold by
Snodgrass Joshua and Snodgrass Kristel
Bought by
Barnett Jonathan
Purchase Details
Closed on
May 15, 2008
Sold by
Mcwilliams Kenneth G and Mcwilliams Kerrill S
Bought by
Snodgrass Joshua and Snodgrass Kristel
Home Financials for this Owner
Home Financials are based on the most recent Mortgage that was taken out on this home.
Original Mortgage
$33,000
Interest Rate
5.44%
Mortgage Type
FHA
Create a Home Valuation Report for This Property
The Home Valuation Report is an in-depth analysis detailing your home's value as well as a comparison with similar homes in the area
Home Values in the Area
Average Home Value in this Area
Purchase History
| Date | Buyer | Sale Price | Title Company |
|---|---|---|---|
| Josiah Holdings Llc | $11,000 | None Listed On Document | |
| Newline Llc | -- | None Listed On Document | |
| Collins Chad | -- | Preferred Title | |
| Barnett Jonathan | -- | None Available | |
| Barnett Jonathan | -- | Preferred Title | |
| Snodgrass Joshua | -- | First American Hall Abstract |
Source: Public Records
Mortgage History
| Date | Status | Borrower | Loan Amount |
|---|---|---|---|
| Previous Owner | Snodgrass Joshua | $33,000 |
Source: Public Records
Tax History Compared to Growth
Tax History
| Year | Tax Paid | Tax Assessment Tax Assessment Total Assessment is a certain percentage of the fair market value that is determined by local assessors to be the total taxable value of land and additions on the property. | Land | Improvement |
|---|---|---|---|---|
| 2024 | $72 | $970 | $760 | $210 |
| 2023 | $72 | $3,230 | $760 | $2,470 |
| 2022 | $215 | $3,230 | $760 | $2,470 |
| 2021 | $216 | $3,230 | $760 | $2,470 |
| 2020 | $214 | $3,230 | $760 | $2,470 |
| 2019 | $207 | $3,230 | $760 | $2,470 |
| 2018 | $187 | $3,230 | $760 | $2,470 |
| 2017 | $185 | $3,230 | $0 | $0 |
| 2015 | $181 | $3,230 | $0 | $0 |
| 2014 | $181 | $3,230 | $0 | $0 |
Source: Public Records
Map
Nearby Homes
- 0 S 22nd St
- 2814 S 20th St
- 2715 S 19th St
- 2824 S 17th St
- 2704 S 17th St
- 3736 S 11th Street Rd
- 1613 Frankie Ln
- 2326 S 19th St
- 2502 S 15th St
- 2314 S 19th St
- 2306 S 19th St
- 2330 S 16th St
- 2908 Pear St
- 2340 S 13th St
- 2117 S 18th St
- 1809 Pacific St
- 2016 Scott St
- 2203 Vories St
- 2326 S 11th St
- 2205 Vories St
- 2103 Pear St
- 3115 S 21st St
- 2107 Pear St
- 2015 Garfield Ave
- 2113 Garfield Ave
- 2115 Garfield Ave
- 3102 S 22nd St
- 3206 S 22nd St
- 2119 Garfield Ave
- 2001 Garfield Ave
- 3042 S 22nd St
- 2123 Garfield Ave
- 3201 S 22nd St
- 3203 S 22nd St
- 1921 Garfield Ave
- 3205 S 22nd St
- 3211 S 22nd St
- 3041 S 22nd St
- 2214 Pear St
- 3412 S 22nd St