2101 Quenby St Houston, TX 77005
University Place NeighborhoodEstimated Value: $1,697,000 - $2,168,000
3
Beds
3
Baths
2,520
Sq Ft
$741/Sq Ft
Est. Value
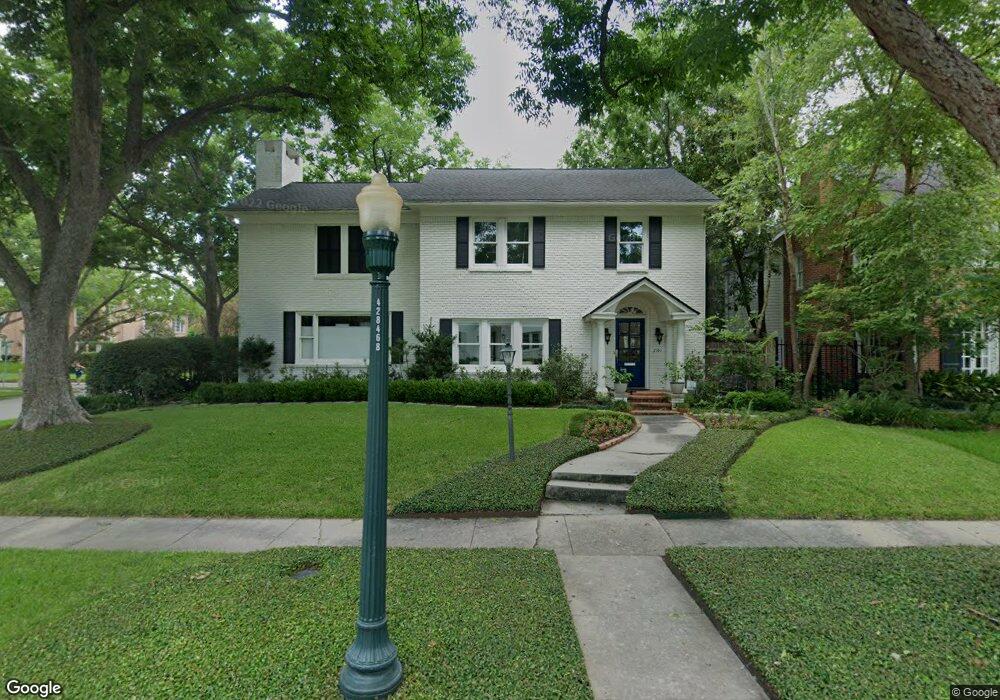
About This Home
This home is located at 2101 Quenby St, Houston, TX 77005 and is currently estimated at $1,866,093, approximately $740 per square foot. 2101 Quenby St is a home located in Harris County with nearby schools including Poe Elementary School, Lanier Middle School, and Lamar High School.
Ownership History
Date
Name
Owned For
Owner Type
Purchase Details
Closed on
Feb 27, 2007
Sold by
Mcalpine Fraser A and Mcalpine Alice B
Bought by
Juedeman Mark E and Juedeman Katherine K
Current Estimated Value
Home Financials for this Owner
Home Financials are based on the most recent Mortgage that was taken out on this home.
Original Mortgage
$417,000
Outstanding Balance
$251,713
Interest Rate
6.21%
Mortgage Type
Purchase Money Mortgage
Estimated Equity
$1,614,380
Create a Home Valuation Report for This Property
The Home Valuation Report is an in-depth analysis detailing your home's value as well as a comparison with similar homes in the area
Home Values in the Area
Average Home Value in this Area
Purchase History
| Date | Buyer | Sale Price | Title Company |
|---|---|---|---|
| Juedeman Mark E | -- | Pinnacle Title Co Lp |
Source: Public Records
Mortgage History
| Date | Status | Borrower | Loan Amount |
|---|---|---|---|
| Open | Juedeman Mark E | $417,000 |
Source: Public Records
Tax History Compared to Growth
Tax History
| Year | Tax Paid | Tax Assessment Tax Assessment Total Assessment is a certain percentage of the fair market value that is determined by local assessors to be the total taxable value of land and additions on the property. | Land | Improvement |
|---|---|---|---|---|
| 2025 | $20,207 | $1,644,478 | $919,050 | $725,428 |
| 2024 | $20,207 | $1,578,524 | $919,050 | $659,474 |
| 2023 | $20,207 | $1,542,597 | $919,050 | $623,547 |
| 2022 | $31,290 | $1,421,053 | $891,200 | $529,853 |
| 2021 | $31,037 | $1,331,662 | $807,650 | $524,012 |
| 2020 | $35,306 | $1,457,981 | $779,800 | $678,181 |
| 2019 | $34,781 | $1,374,500 | $779,800 | $594,700 |
| 2018 | $26,244 | $1,304,849 | $751,950 | $552,899 |
| 2017 | $25,513 | $1,008,985 | $751,950 | $257,035 |
| 2016 | $23,743 | $939,000 | $724,100 | $214,900 |
| 2015 | $14,168 | $962,603 | $724,100 | $238,503 |
| 2014 | $14,168 | $696,250 | $590,420 | $105,830 |
Source: Public Records
Map
Nearby Homes
- 2121 Quenby St
- 2129 Quenby St
- 2135 Quenby St
- 2216 Tangley St
- 1928 Dunstan Rd
- 2215 Dunstan Rd
- 2114 Wroxton Rd
- 2019 Bissonnet St
- 2042 Bissonnet St
- 1832 Albans Rd
- 5228 Hazard St
- 1804 Bolsover St
- 1801 Sunset Blvd
- 2039 South Blvd
- 2130 South Blvd
- 2320 Wroxton Rd
- 1723 Sunset Blvd
- 2332 Wroxton Rd
- 1723 Albans Rd
- 2370 Bolsover St
- 2105 Quenby St
- 2102 Tangley St
- 2108 Tangley St
- 2109 Quenby St
- 2032 Quenby St
- 2102 Quenby St
- 2108 Quenby St
- 2117 Quenby St
- 2030 Quenby St
- 2112 Quenby St
- 2114 Tangley St
- 2033 Quenby St
- 2028 Quenby St
- 2116 Quenby St
- 2120 Tangley St
- 2103 Tangley St
- 2027 Quenby St
- 2107 Sunset Blvd
- 2031 Sunset Blvd
- 2107 Tangley St