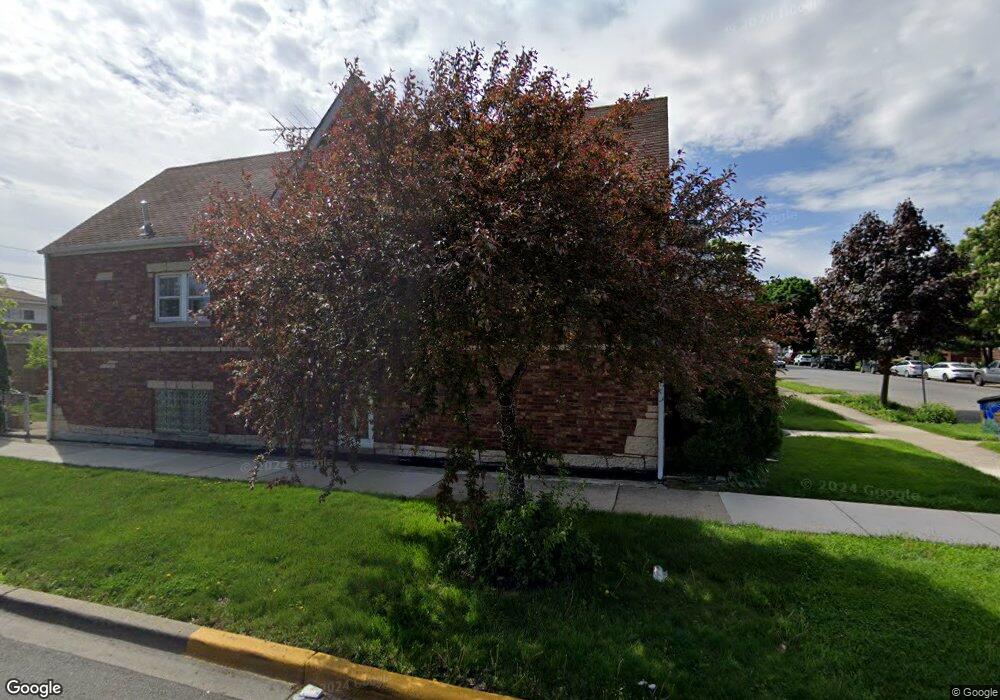
2101 Ridgeland Ave Berwyn, IL 60402
Estimated Value: $352,000 - $408,000
3
Beds
2
Baths
1,985
Sq Ft
$194/Sq Ft
Est. Value
About This Home
This home is located at 2101 Ridgeland Ave, Berwyn, IL 60402 and is currently estimated at $385,151, approximately $194 per square foot. 2101 Ridgeland Ave is a home located in Cook County with nearby schools including Karel Havlicek Elementary School, Lincoln Middle School, and J Sterling Morton West High School.
Ownership History
Date
Name
Owned For
Owner Type
Purchase Details
Closed on
Jun 15, 2007
Sold by
Deschaine Christopher and Deschaine Gabrielle A
Bought by
Cruz Lourdes L
Current Estimated Value
Home Financials for this Owner
Home Financials are based on the most recent Mortgage that was taken out on this home.
Original Mortgage
$206,000
Outstanding Balance
$130,623
Interest Rate
6.87%
Mortgage Type
New Conventional
Estimated Equity
$254,528
Purchase Details
Closed on
Jul 30, 2001
Sold by
King Bruwaert House
Bought by
Deschaine Christopher and Deschaine Gabrielle A
Home Financials for this Owner
Home Financials are based on the most recent Mortgage that was taken out on this home.
Original Mortgage
$154,533
Interest Rate
7.15%
Mortgage Type
FHA
Purchase Details
Closed on
Jun 22, 2001
Sold by
Lasalle Bank National Assn
Bought by
King Bruwaert House
Home Financials for this Owner
Home Financials are based on the most recent Mortgage that was taken out on this home.
Original Mortgage
$154,533
Interest Rate
7.15%
Mortgage Type
FHA
Create a Home Valuation Report for This Property
The Home Valuation Report is an in-depth analysis detailing your home's value as well as a comparison with similar homes in the area
Home Values in the Area
Average Home Value in this Area
Purchase History
| Date | Buyer | Sale Price | Title Company |
|---|---|---|---|
| Cruz Lourdes L | $257,500 | Multiple | |
| Deschaine Christopher | $157,000 | -- | |
| King Bruwaert House | -- | -- |
Source: Public Records
Mortgage History
| Date | Status | Borrower | Loan Amount |
|---|---|---|---|
| Open | Cruz Lourdes L | $206,000 | |
| Previous Owner | Deschaine Christopher | $154,533 |
Source: Public Records
Tax History Compared to Growth
Tax History
| Year | Tax Paid | Tax Assessment Tax Assessment Total Assessment is a certain percentage of the fair market value that is determined by local assessors to be the total taxable value of land and additions on the property. | Land | Improvement |
|---|---|---|---|---|
| 2024 | $8,792 | $29,472 | $4,560 | $24,912 |
| 2023 | $5,901 | $33,000 | $4,560 | $28,440 |
| 2022 | $5,901 | $18,145 | $3,952 | $14,193 |
| 2021 | $5,655 | $18,145 | $3,952 | $14,193 |
| 2020 | $6,672 | $21,051 | $3,952 | $17,099 |
| 2019 | $6,224 | $18,519 | $3,572 | $14,947 |
| 2018 | $6,752 | $20,476 | $3,572 | $16,904 |
| 2017 | $6,566 | $20,476 | $3,572 | $16,904 |
| 2016 | $5,522 | $15,552 | $2,964 | $12,588 |
| 2015 | $5,366 | $15,552 | $2,964 | $12,588 |
| 2014 | $5,238 | $15,552 | $2,964 | $12,588 |
| 2013 | $4,810 | $16,038 | $2,964 | $13,074 |
Source: Public Records
Map
Nearby Homes
- 2114 Highland Ave
- 1938 Highland Ave
- 2127 Highland Ave
- 2215 Cuyler Ave
- 2102 Gunderson Ave
- 1855 Ridgeland Ave
- 1935 Harvey Ave
- 1842 Elmwood Ave
- 2107 East Ave
- 2235 Harvey Ave
- 2310 Gunderson Ave
- 2223 S Lombard Ave
- 1805 Elmwood Ave
- 1820 Gunderson Ave
- 1932 East Ave
- 2302 Scoville Ave
- 1910 S 61st Ct
- 2343 Ridgeland Ave
- 6401 W 23rd St Unit 5
- 6117 W Cermak Rd
- 2103 Ridgeland Ave
- 2107 Ridgeland Ave
- 1941 Ridgeland Ave
- 1937 Ridgeland Ave
- 2100 Cuyler Ave
- 2106 Cuyler Ave
- 2115 Ridgeland Ave
- 2110 Cuyler Ave
- 1940 Cuyler Ave
- 1933 Ridgeland Ave
- 2117 Ridgeland Ave
- 2114 Cuyler Ave
- 2104 Ridgeland Ave
- 1931 Ridgeland Ave
- 2110 Ridgeland Ave
- 1936 Cuyler Ave
- 2118 Cuyler Ave
- 1932 Cuyler Ave
- 1942 Ridgeland Ave