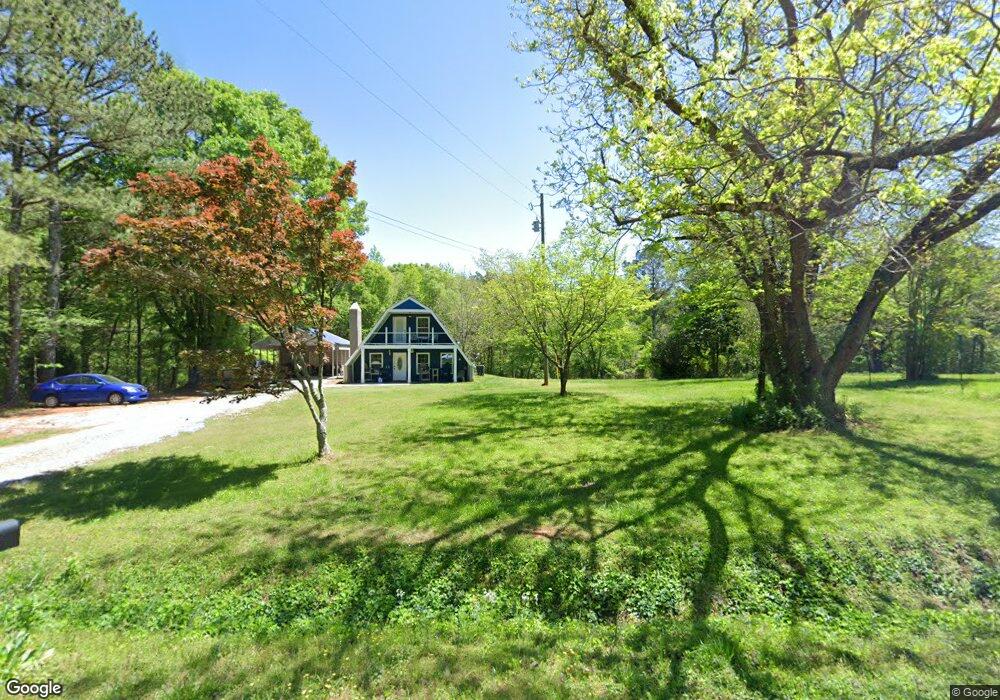
2101 Shady Grove Rd Carrollton, GA 30116
Abilene NeighborhoodEstimated Value: $191,000 - $279,000
3
Beds
2
Baths
1,764
Sq Ft
$141/Sq Ft
Est. Value
About This Home
This home is located at 2101 Shady Grove Rd, Carrollton, GA 30116 and is currently estimated at $248,091, approximately $140 per square foot. 2101 Shady Grove Rd is a home located in Carroll County with nearby schools including Sharp Creek Elementary School, Bay Springs Middle School, and Villa Rica High School.
Ownership History
Date
Name
Owned For
Owner Type
Purchase Details
Closed on
Jan 14, 2021
Sold by
Swofford Jessica M
Bought by
Mckenzie Benjamin P
Current Estimated Value
Purchase Details
Closed on
Feb 28, 2014
Sold by
Mckenzie James M
Bought by
Mckenzie James Robert and Swofford Jessica Mckenzie
Purchase Details
Closed on
Jan 17, 2013
Sold by
Mitchell Christopher J
Bought by
Mckenzie James M
Purchase Details
Closed on
Jun 9, 2010
Sold by
Mitchell Ralph
Bought by
Mitchell Christopher J
Purchase Details
Closed on
Sep 30, 2009
Sold by
Mitchell Ralph
Bought by
Mitchell Christopher J
Purchase Details
Closed on
Jun 16, 2009
Sold by
Mitchell Christopher J
Bought by
Mitchell Ralph
Purchase Details
Closed on
Jun 9, 2006
Sold by
Mitchell Sherry Dean
Bought by
Mitchell Christopher J
Purchase Details
Closed on
Jan 31, 2005
Sold by
Brumbelow
Bought by
Brumbelow Mary Nell Estate
Purchase Details
Closed on
Sep 19, 1952
Bought by
Brumbelow
Create a Home Valuation Report for This Property
The Home Valuation Report is an in-depth analysis detailing your home's value as well as a comparison with similar homes in the area
Home Values in the Area
Average Home Value in this Area
Purchase History
| Date | Buyer | Sale Price | Title Company |
|---|---|---|---|
| Mckenzie Benjamin P | -- | -- | |
| Mckenzie James Robert | -- | -- | |
| Mckenzie James M | $20,000 | -- | |
| Mitchell Christopher J | -- | -- | |
| Mitchell Christopher J | -- | -- | |
| Mckenzie James M | $80,000 | -- | |
| Mitchell Ralph | -- | -- | |
| Mitchell Ralph | -- | -- | |
| Mitchell Christopher J | -- | -- | |
| Brumbelow Mary Nell Estate | -- | -- | |
| Brumbelow | -- | -- |
Source: Public Records
Tax History Compared to Growth
Tax History
| Year | Tax Paid | Tax Assessment Tax Assessment Total Assessment is a certain percentage of the fair market value that is determined by local assessors to be the total taxable value of land and additions on the property. | Land | Improvement |
|---|---|---|---|---|
| 2024 | $2,324 | $102,750 | $19,871 | $82,879 |
| 2023 | $2,324 | $91,413 | $15,897 | $75,516 |
| 2022 | $502 | $20,008 | $10,598 | $9,410 |
| 2021 | $428 | $16,678 | $8,478 | $8,200 |
| 2020 | $383 | $14,937 | $7,708 | $7,229 |
| 2019 | $372 | $14,392 | $7,708 | $6,684 |
| 2018 | $352 | $13,404 | $7,204 | $6,200 |
| 2017 | $353 | $13,404 | $7,204 | $6,200 |
| 2016 | $353 | $13,404 | $7,204 | $6,200 |
| 2015 | $489 | $17,493 | $8,941 | $8,552 |
| 2014 | $225 | $30,496 | $8,941 | $21,555 |
Source: Public Records
Map
Nearby Homes
- 0 Shady Grove Rd Unit 10601173
- 0 Shady Grove Rd Unit 10601172
- 1890 Shady Grove Rd
- 0 Knight Dr W
- 255 Emerald Pointe Dr
- 0 Old Airport Rd Unit 10599783
- 0 Old Airport Rd Unit 7642336
- 0 Old Airport Rd Unit 10599779
- The McGinnis Plan at Morgan Landing
- 221 Turtle Cove
- 131 Hunter Way
- 255 Morgan Rd
- 2580 Shady Grove Rd
- 211 Greystone Dr
- 105 Providence Ct
- 201 Deerfield Ln
- 133 Deerfield Ln
- 0 Frashier Rd Unit 7549781
- 0 Frashier Rd Unit 10488685
- 1196 N Highway 113
- 2111 Shady Grove Rd
- 0 Shady Grove Rd Unit 10228247
- 0 Shady Grove Rd Unit 10274438
- 0 Shady Grove Rd Unit 10292453
- 0 Shady Grove Rd Unit 20169206
- 0 Shady Grove Rd Unit 7240257
- 0 Shady Grove Rd Unit 7206077
- 0 Shady Grove Rd Unit 7126761
- 0 Shady Grove Rd Unit 7068507
- 0 Shady Grove Rd Unit 7029642
- 0 Shady Grove Rd Unit 7029311
- 0 Shady Grove Rd Unit 3148305
- 0 Shady Grove Rd Unit 8155750
- 0 Shady Grove Rd Unit 7029672
- 0 Shady Grove Rd Unit 8016377
- 0 Shady Grove Rd Unit 7622987
- 0 Shady Grove Rd Unit 7468056
- 0 Shady Grove Rd Unit 7344352
- 0 Shady Grove Rd Unit 7242474
- 0 Shady Grove Rd Unit 7628222