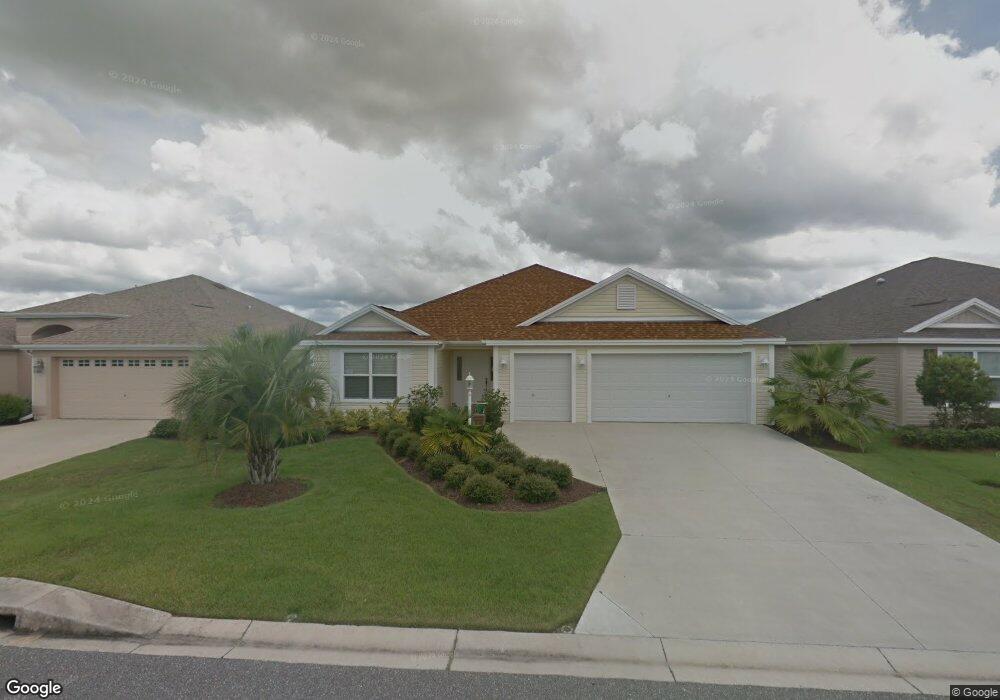
2101 Triggerfish Run The Villages, FL 32162
Village of Pennecamp NeighborhoodEstimated Value: $437,970 - $473,000
Studio
--
Bath
1,956
Sq Ft
$235/Sq Ft
Est. Value
About This Home
This home is located at 2101 Triggerfish Run, The Villages, FL 32162 and is currently estimated at $460,493, approximately $235 per square foot. 2101 Triggerfish Run is a home.
Ownership History
Date
Name
Owned For
Owner Type
Purchase Details
Closed on
Aug 23, 2021
Sold by
Paoli Michael and Paoli Susan C
Bought by
Paoli Michael and Paoli Susan C
Current Estimated Value
Purchase Details
Closed on
Feb 27, 2019
Sold by
Minnick John E and Minnick Karen L
Bought by
Paoli Michael and Paoli Susan C
Home Financials for this Owner
Home Financials are based on the most recent Mortgage that was taken out on this home.
Original Mortgage
$292,500
Outstanding Balance
$256,112
Interest Rate
4.4%
Mortgage Type
New Conventional
Estimated Equity
$204,381
Purchase Details
Closed on
Oct 20, 2015
Sold by
Minnick John E and Minnick Karen L
Bought by
The Minnick Family Trust and Minnick Karen L
Purchase Details
Closed on
Jul 14, 2014
Sold by
Bonomo Jonathan G and Bonomo Elizabeth M
Bought by
Minnick John E and Minnick Karen L
Home Financials for this Owner
Home Financials are based on the most recent Mortgage that was taken out on this home.
Original Mortgage
$250,200
Interest Rate
3.31%
Mortgage Type
New Conventional
Create a Home Valuation Report for This Property
The Home Valuation Report is an in-depth analysis detailing your home's value as well as a comparison with similar homes in the area
Home Values in the Area
Average Home Value in this Area
Purchase History
| Date | Buyer | Sale Price | Title Company |
|---|---|---|---|
| Paoli Michael | -- | Accommodation | |
| Paoli Michael | $325,000 | Peninsula Land & Title | |
| The Minnick Family Trust | -- | Attorney | |
| Minnick John E | $278,000 | Attorney |
Source: Public Records
Mortgage History
| Date | Status | Borrower | Loan Amount |
|---|---|---|---|
| Open | Paoli Michael | $292,500 | |
| Previous Owner | Minnick John E | $250,200 | |
| Closed | Paoli Michael | $0 |
Source: Public Records
Tax History
| Year | Tax Paid | Tax Assessment Tax Assessment Total Assessment is a certain percentage of the fair market value that is determined by local assessors to be the total taxable value of land and additions on the property. | Land | Improvement |
|---|---|---|---|---|
| 2025 | $3,626 | $304,580 | -- | -- |
| 2024 | $3,347 | $296,000 | -- | -- |
| 2023 | $3,347 | $287,380 | $0 | $0 |
| 2022 | $3,253 | $279,010 | $0 | $0 |
| 2021 | $3,436 | $270,890 | $21,790 | $249,100 |
| 2020 | $3,677 | $281,270 | $16,380 | $264,890 |
| 2019 | $4,341 | $210,690 | $0 | $0 |
| 2018 | $4,103 | $206,770 | $16,380 | $190,390 |
| 2017 | $4,432 | $208,820 | $16,380 | $192,440 |
| 2016 | $4,444 | $210,860 | $0 | $0 |
| 2015 | $4,525 | $214,630 | $0 | $0 |
| 2014 | $4,286 | $189,760 | $0 | $0 |
Source: Public Records
Map
Nearby Homes
- 1762 Meadowlark Ave
- 1998 Jonquil Place
- 1692 Indigo Ave
- 1972 Ashwood Run
- 1865 Claverton St
- 1850 Lake Ridge Dr
- 5433 County Road 125
- 2000 Goldenrod Ct
- 1967 Lake Ridge Dr
- 1988 Dove Hollow Run
- 9336 County Road 125d
- 1850 Kyrle Terrace
- 2237 Baypoint Way
- 1866 Kyrle Terrace
- 5353 County Road 125
- 2473 Buttonwood Run
- 2311 Crestview St
- 1769 Apalachee Ave
- 2055 Hydrangea Ave
- 1651 Edisto Ln
- 2093 Triggerfish Run
- 2105 Triggerfish Run
- 2094 Trout Ct
- 2086 Trout Ct
- 2113 Triggerfish Run
- 2085 Triggerfish Run
- 2102 Trout Ct
- 2078 Trout Ct
- 2100 Triggerfish Run
- 2108 Triggerfish Run
- 2092 Triggerfish Run
- 2110 Trout Ct
- 2079 Triggerfish Run Unit 167
- 2084 Triggerfish Run
- 2093 Trout Ct
- 2099 Trout Ct
- 2087 Trout Ct
- 2071 Triggerfish Run
- 2062 Trout Ct
- 2076 Triggerfish Run
Your Personal Tour Guide
Ask me questions while you tour the home.