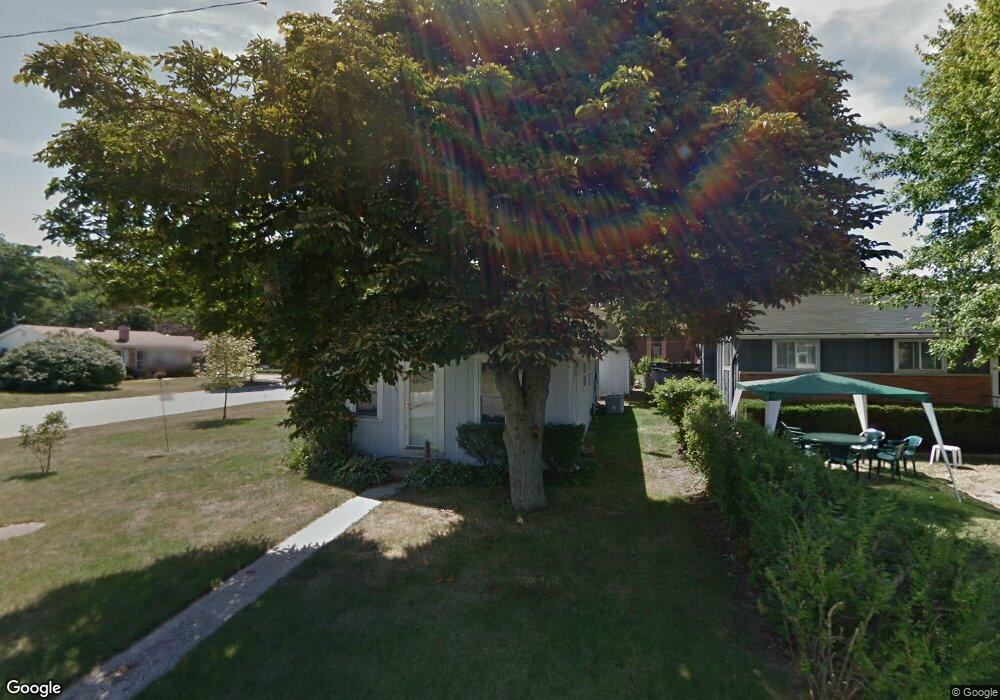
2102 Elmwood St Port Huron, MI 48060
Estimated Value: $128,000 - $152,000
3
Beds
1
Bath
880
Sq Ft
$163/Sq Ft
Est. Value
About This Home
This home is located at 2102 Elmwood St, Port Huron, MI 48060 and is currently estimated at $143,455, approximately $163 per square foot. 2102 Elmwood St is a home located in St. Clair County with nearby schools including H.D. Crull Elementary School, Holland Woods Middle School, and Port Huron Northern High School.
Ownership History
Date
Name
Owned For
Owner Type
Purchase Details
Closed on
Nov 5, 2020
Sold by
Digiuseppe Rosalind
Bought by
Johnson Katherine Ann and Johnson Kenneth E
Current Estimated Value
Purchase Details
Closed on
Mar 4, 2020
Sold by
Lakeview Loan Servicing Llc
Bought by
Thiele Wing Lee and Thiele Tyler Lee
Purchase Details
Closed on
Nov 14, 2019
Sold by
Sheriff Of St Clair County
Bought by
Lakeview Loan Servicing Llc
Create a Home Valuation Report for This Property
The Home Valuation Report is an in-depth analysis detailing your home's value as well as a comparison with similar homes in the area
Home Values in the Area
Average Home Value in this Area
Purchase History
| Date | Buyer | Sale Price | Title Company |
|---|---|---|---|
| Johnson Katherine Ann | $82,600 | None Available | |
| Thiele Wing Lee | $57,020 | None Available | |
| Lakeview Loan Servicing Llc | $49,798 | None Listed On Document |
Source: Public Records
Tax History Compared to Growth
Tax History
| Year | Tax Paid | Tax Assessment Tax Assessment Total Assessment is a certain percentage of the fair market value that is determined by local assessors to be the total taxable value of land and additions on the property. | Land | Improvement |
|---|---|---|---|---|
| 2025 | $2,365 | $61,500 | $0 | $0 |
| 2024 | $2,020 | $56,700 | $0 | $0 |
| 2023 | $1,908 | $52,100 | $0 | $0 |
| 2022 | $2,756 | $45,800 | $0 | $0 |
| 2021 | $2,594 | $42,100 | $0 | $0 |
| 2020 | $1,323 | $39,800 | $39,800 | $0 |
| 2019 | $1,300 | $31,500 | $0 | $0 |
| 2018 | $1,271 | $31,500 | $0 | $0 |
| 2017 | $1,136 | $28,100 | $0 | $0 |
| 2016 | $965 | $28,100 | $0 | $0 |
| 2015 | $947 | $27,000 | $27,000 | $0 |
| 2014 | $947 | $27,300 | $27,300 | $0 |
| 2013 | -- | $26,700 | $0 | $0 |
Source: Public Records
Map
Nearby Homes
- 2215 Hancock St
- 1907 Riverside Dr
- 1819 Riverside Dr
- 2812 19th Ave
- 2838 Elmwood St
- 2549 Riverwood Dr
- 2806 Woodstock Dr
- 1649 Whipple St
- 1620 McBrady St
- 0000 Campau Ave
- 0000 Water St
- V/L #4 Water St
- V/L #6 Water St
- V/L #5 Water St
- V/L #8 Water St
- V/L #3 Water St
- 2857 Riverside Dr
- 1434 Schumaker St
- 1531 Robinson St
- 1534 12th Ave