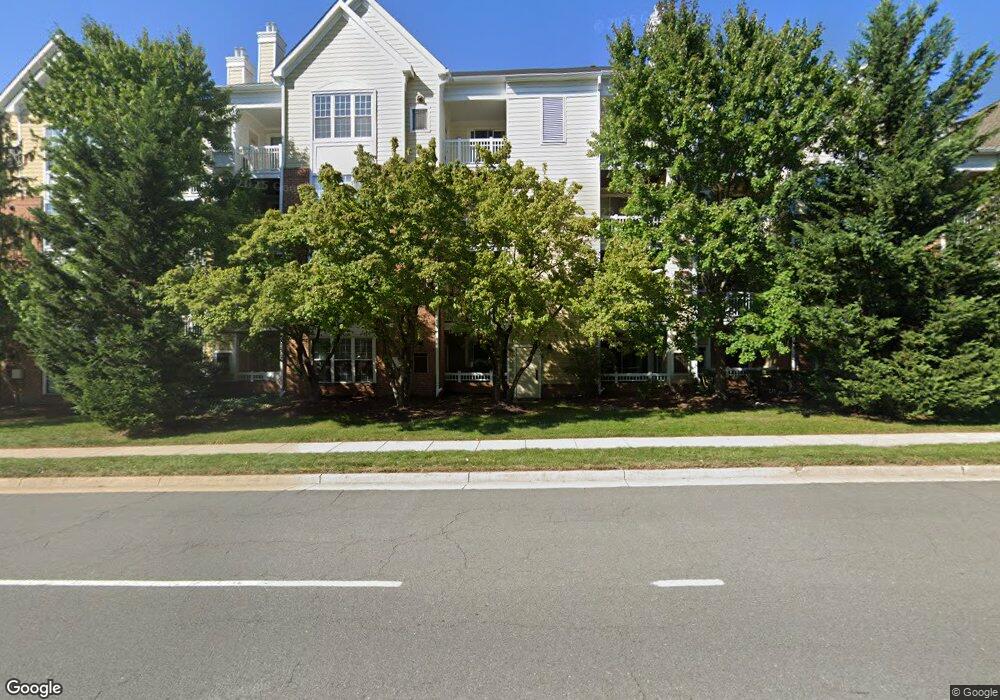
2102 Highcourt Ln Unit 305 Herndon, VA 20170
Estimated Value: $361,000 - $377,000
2
Beds
2
Baths
1,140
Sq Ft
$324/Sq Ft
Est. Value
About This Home
This home is located at 2102 Highcourt Ln Unit 305, Herndon, VA 20170 and is currently estimated at $369,177, approximately $323 per square foot. 2102 Highcourt Ln Unit 305 is a home located in Fairfax County with nearby schools including L.L. Coates Elementary School, Herndon Middle School, and Herndon High School.
Ownership History
Date
Name
Owned For
Owner Type
Purchase Details
Closed on
May 4, 2011
Sold by
Mason David
Bought by
Hubbard Bernard
Current Estimated Value
Home Financials for this Owner
Home Financials are based on the most recent Mortgage that was taken out on this home.
Original Mortgage
$237,274
Outstanding Balance
$164,894
Interest Rate
4.88%
Mortgage Type
FHA
Estimated Equity
$204,283
Purchase Details
Closed on
Mar 28, 2006
Sold by
Terrazas Kathleen
Bought by
Mason David and Peyton,Lindsay
Home Financials for this Owner
Home Financials are based on the most recent Mortgage that was taken out on this home.
Original Mortgage
$276,000
Interest Rate
6.32%
Mortgage Type
New Conventional
Purchase Details
Closed on
Jul 26, 1996
Sold by
Dulles Residential One Lp
Bought by
Terrazas Kathleen J
Home Financials for this Owner
Home Financials are based on the most recent Mortgage that was taken out on this home.
Original Mortgage
$116,600
Interest Rate
8.37%
Create a Home Valuation Report for This Property
The Home Valuation Report is an in-depth analysis detailing your home's value as well as a comparison with similar homes in the area
Home Values in the Area
Average Home Value in this Area
Purchase History
| Date | Buyer | Sale Price | Title Company |
|---|---|---|---|
| Hubbard Bernard | $245,000 | -- | |
| Mason David | $316,000 | -- | |
| Terrazas Kathleen J | $119,900 | -- |
Source: Public Records
Mortgage History
| Date | Status | Borrower | Loan Amount |
|---|---|---|---|
| Open | Hubbard Bernard | $237,274 | |
| Previous Owner | Mason David | $276,000 | |
| Previous Owner | Terrazas Kathleen J | $116,600 |
Source: Public Records
Tax History Compared to Growth
Tax History
| Year | Tax Paid | Tax Assessment Tax Assessment Total Assessment is a certain percentage of the fair market value that is determined by local assessors to be the total taxable value of land and additions on the property. | Land | Improvement |
|---|---|---|---|---|
| 2025 | $4,524 | $341,270 | $68,000 | $273,270 |
| 2024 | $4,524 | $318,940 | $64,000 | $254,940 |
| 2023 | $4,300 | $309,650 | $62,000 | $247,650 |
| 2022 | $4,115 | $292,120 | $58,000 | $234,120 |
| 2021 | $3,116 | $265,560 | $53,000 | $212,560 |
| 2020 | $3,022 | $255,350 | $51,000 | $204,350 |
| 2019 | $2,796 | $236,210 | $47,000 | $189,210 |
| 2018 | $2,695 | $234,340 | $47,000 | $187,340 |
| 2017 | $2,616 | $225,330 | $45,000 | $180,330 |
| 2016 | $2,721 | $234,840 | $47,000 | $187,840 |
| 2015 | $2,621 | $234,840 | $47,000 | $187,840 |
| 2014 | $2,615 | $234,840 | $47,000 | $187,840 |
Source: Public Records
Map
Nearby Homes
- 12901 Alton Square Unit 102
- 2111 Highcourt Ln Unit 302
- 12913 Alton Square Unit 219
- 2204 Westcourt Ln Unit 318
- 2204 Westcourt Ln Unit 109
- 2204 Westcourt Ln Unit 116
- 2204 Westcourt Ln Unit 201
- 12919 Alton Square Unit 215
- 12919 Alton Square Unit 117
- 12919 Alton Square Unit 116
- 12915 Alton Square Unit 416
- 12915 Alton Square Unit 117
- 312 Holly Ct
- 12880 Mosaic Park Way Unit 1-X
- 12850 Mosaic Way Unit 2U
- 12865 Mosaic Park Way Unit 3Y
- 310 Missouri Ave
- 719 Palmer Dr
- 12953 Centre Park Cir Unit 218
- 12953 Centre Park Cir Unit 222
- 2102 Highcourt Ln Unit 303
- 2102 Highcourt Ln Unit 202
- 2102 Highcourt Ln Unit 203
- 2102 Highcourt Ln Unit 301
- 2102 Highcourt Ln Unit 103
- 2102 Highcourt Ln Unit 302
- 2102 Highcourt Ln Unit 101
- 2100 Highcourt Ln Unit 203
- 2100 Highcourt Ln Unit 202
- 2100 Highcourt Ln Unit 201
- 2100 Highcourt Ln Unit 301
- 2100 Highcourt Ln Unit 302
- 2100 Highcourt Ln Unit 102
- 2100 Highcourt Ln Unit 103
- 2100 Highcourt Ln Unit 101
- 12907 Alton Square Unit 202
- 12907 Alton Square Unit 302
- 12907 Alton Square Unit 103
- 12907 Alton Square Unit 203
- 12907 Alton Square Unit 102