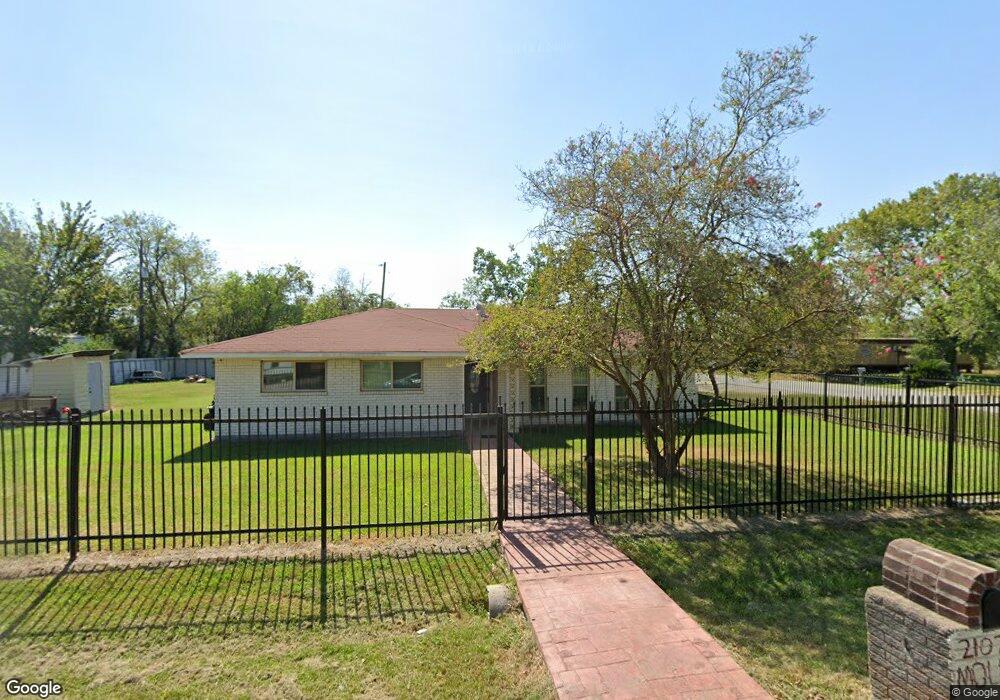
2102 Molly St Houston, TX 77039
East Aldine NeighborhoodEstimated Value: $263,000 - $346,000
3
Beds
2
Baths
2,103
Sq Ft
$146/Sq Ft
Est. Value
About This Home
This home is located at 2102 Molly St, Houston, TX 77039 and is currently estimated at $307,538, approximately $146 per square foot. 2102 Molly St is a home located in Harris County with nearby schools including Calvert Elementary School, Aldine Middle School, and Macarthur Ninth Grade School.
Ownership History
Date
Name
Owned For
Owner Type
Purchase Details
Closed on
May 7, 2020
Sold by
Herminia Gonzalez Claudia
Bought by
Aranda-Flores Jassiel
Current Estimated Value
Purchase Details
Closed on
Jun 4, 2015
Sold by
Nandlal Taranpersad and Nandlal Kalautie
Bought by
Aranda Jessiel and Aranda Juan J
Home Financials for this Owner
Home Financials are based on the most recent Mortgage that was taken out on this home.
Original Mortgage
$145,500
Interest Rate
3.82%
Mortgage Type
New Conventional
Purchase Details
Closed on
Mar 14, 1997
Sold by
Gaw Walton Y C and Gaw Meiyee
Bought by
Nandlal Taran Persad and Nandlal Indra
Home Financials for this Owner
Home Financials are based on the most recent Mortgage that was taken out on this home.
Original Mortgage
$40,000
Interest Rate
7.74%
Mortgage Type
Seller Take Back
Create a Home Valuation Report for This Property
The Home Valuation Report is an in-depth analysis detailing your home's value as well as a comparison with similar homes in the area
Home Values in the Area
Average Home Value in this Area
Purchase History
| Date | Buyer | Sale Price | Title Company |
|---|---|---|---|
| Aranda-Flores Jassiel | -- | None Listed On Document | |
| Aranda Jessiel | -- | North American Title | |
| Nandlal Taran Persad | -- | -- |
Source: Public Records
Mortgage History
| Date | Status | Borrower | Loan Amount |
|---|---|---|---|
| Previous Owner | Aranda Jessiel | $145,500 | |
| Previous Owner | Nandlal Taran Persad | $40,000 |
Source: Public Records
Tax History Compared to Growth
Tax History
| Year | Tax Paid | Tax Assessment Tax Assessment Total Assessment is a certain percentage of the fair market value that is determined by local assessors to be the total taxable value of land and additions on the property. | Land | Improvement |
|---|---|---|---|---|
| 2025 | $3,008 | $334,777 | $64,325 | $270,452 |
| 2024 | $3,008 | $321,890 | $51,150 | $270,740 |
| 2023 | $3,008 | $310,670 | $39,930 | $270,740 |
| 2022 | $3,800 | $185,393 | $17,243 | $168,150 |
| 2021 | $3,891 | $185,393 | $16,880 | $168,513 |
| 2020 | $3,730 | $185,393 | $16,880 | $168,513 |
| 2019 | $3,551 | $179,891 | $16,880 | $163,011 |
| 2018 | $1,150 | $105,120 | $18,150 | $86,970 |
| 2017 | $2,796 | $123,360 | $18,150 | $105,210 |
| 2016 | $2,796 | $123,360 | $18,150 | $105,210 |
| 2015 | $2,747 | $123,360 | $18,150 | $105,210 |
| 2014 | $2,747 | $123,360 | $18,150 | $105,210 |
Source: Public Records
Map
Nearby Homes
- 14537 Maeline St
- 2127 Maximilian St Unit 10
- 2243 Matilda St
- 1826 Gault Rd
- 1916 Gault Rd
- 1631 Gault Rd
- 1718 W E Airtex Hardy E Airtex Rd
- 1725 Strawn Rd
- 1722 Strawn Rd
- 1730 Strawn Rd
- 1720 Strawn Rd
- 13917 Chrisman Rd
- 2434 Balmorhea Ave
- 2438 Balmorhea Ave
- 2807 Verhalen Ave
- 2715 Toyah Ave
- 13920 Reeveston Rd
- 2611 Lauder Rd
- 2703 Lauder Rd
- 2710 Woodgate St
- 2103 Maurine St
- 14428 Maeline St
- 14437 Maeline St
- 2111 Maurine St
- 14424 Maeline St
- 2107 Molly St
- 2103 Molly St
- 2113 Maurine St
- 14501 Maeline St
- 2122 Molly St
- 14421 Maeline St
- 2119 Molly St
- 14418 Aldine Westfield Rd
- 14418 Aldine Westfield Rd Unit 3
- 14514 Maeline St
- 0 Maurine St
- 2102 Maurine St
- 2127 Maurine St
- 2118 Melissa St
- 2126 Molly St