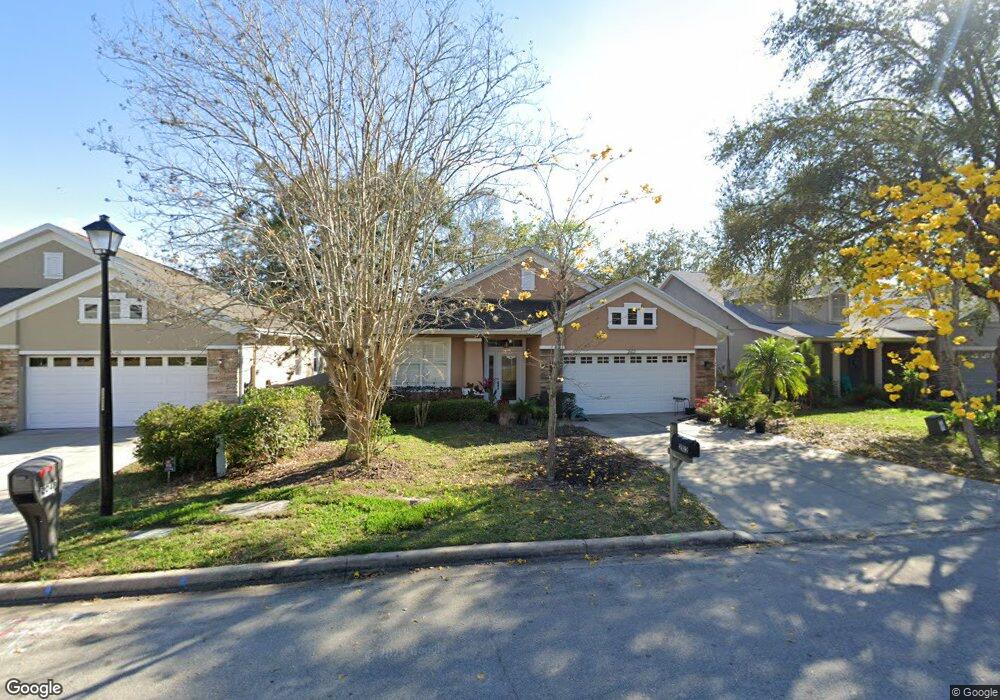
2102 Old South Ln Apopka, FL 32712
Estimated Value: $371,000 - $408,000
3
Beds
2
Baths
2,054
Sq Ft
$190/Sq Ft
Est. Value
About This Home
This home is located at 2102 Old South Ln, Apopka, FL 32712 and is currently estimated at $391,272, approximately $190 per square foot. 2102 Old South Ln is a home located in Orange County with nearby schools including Apopka Elementary School, Wolf Lake Middle School, and Apopka High School.
Ownership History
Date
Name
Owned For
Owner Type
Purchase Details
Closed on
Jul 5, 2016
Sold by
Rowe Vincent L
Bought by
Rowe Vincent L
Current Estimated Value
Purchase Details
Closed on
Aug 31, 2011
Sold by
Rowe Carmela
Bought by
Rowe Carmela N
Purchase Details
Closed on
Oct 17, 2003
Sold by
Peda Development Llp
Bought by
Rowe Carmela
Home Financials for this Owner
Home Financials are based on the most recent Mortgage that was taken out on this home.
Original Mortgage
$143,000
Outstanding Balance
$64,619
Interest Rate
5.75%
Mortgage Type
Purchase Money Mortgage
Estimated Equity
$326,653
Purchase Details
Closed on
Jan 15, 2003
Sold by
Master Craft Investments
Bought by
Peda Development
Home Financials for this Owner
Home Financials are based on the most recent Mortgage that was taken out on this home.
Original Mortgage
$8,000
Interest Rate
10%
Mortgage Type
Seller Take Back
Create a Home Valuation Report for This Property
The Home Valuation Report is an in-depth analysis detailing your home's value as well as a comparison with similar homes in the area
Home Values in the Area
Average Home Value in this Area
Purchase History
| Date | Buyer | Sale Price | Title Company |
|---|---|---|---|
| Rowe Vincent L | -- | Attorney | |
| Rowe Carmela N | -- | Attorney | |
| Rowe Carmela | $178,900 | Commerce Title Company | |
| Peda Development | $24,500 | Commerce Title Company | |
| Peda Development | $24,500 | Commerce Title Company |
Source: Public Records
Mortgage History
| Date | Status | Borrower | Loan Amount |
|---|---|---|---|
| Open | Rowe Carmela | $143,000 | |
| Previous Owner | Peda Development | $8,000 |
Source: Public Records
Tax History Compared to Growth
Tax History
| Year | Tax Paid | Tax Assessment Tax Assessment Total Assessment is a certain percentage of the fair market value that is determined by local assessors to be the total taxable value of land and additions on the property. | Land | Improvement |
|---|---|---|---|---|
| 2025 | $5,549 | $370,190 | $90,000 | $280,190 |
| 2024 | $4,962 | $356,770 | $90,000 | $266,770 |
| 2023 | $4,962 | $336,801 | $90,000 | $246,801 |
| 2022 | $4,442 | $297,332 | $90,000 | $207,332 |
| 2021 | $3,961 | $246,727 | $65,000 | $181,727 |
| 2020 | $3,592 | $233,171 | $50,000 | $183,171 |
| 2019 | $3,498 | $224,615 | $40,000 | $184,615 |
| 2018 | $3,103 | $187,670 | $40,000 | $147,670 |
| 2017 | $3,028 | $183,791 | $40,000 | $143,791 |
| 2016 | $2,084 | $179,412 | $40,000 | $139,412 |
| 2015 | $2,067 | $170,036 | $40,000 | $130,036 |
| 2014 | $2,082 | $160,597 | $40,000 | $120,597 |
Source: Public Records
Map
Nearby Homes
- 1034 Old South Ln
- 925 Counts Crest Cir
- 1090 Pebble Beach Ct
- 1920 Abbington St Unit 30-D-2
- 1115 Chebon Ct Unit A
- 2068 Nexus Ct
- 858 Errol Pkwy
- 2062 Lake Marion Dr
- 1432 Park Leah
- 908 Hilly Bend Dr
- 2653 Spangler St
- 1542 Islay Ct
- 1628 Lake Marion Dr
- 618 Via Milano
- 1546 Stormway Ct
- 1034 Villa Ln Unit 18
- 1022 Villa Ln Unit 11
- 1337 Villa Ln Unit 49
- 1339 Villa Ln Unit 50
- 1333 Villa Ln Unit 47
- 2048 Old South Ln
- 2112 Old South Ln
- 2112 Old Ln S
- 2040 Old Ln S
- 2120 Old South Ln
- 2040 Old South Ln
- 2120 Old Ln S
- 943 Woodcraft Dr
- 937 Woodcraft Dr
- 1026 Sweet Tree Ct
- 1027 Sweet Tree Ct
- 2128 Old South Ln
- 2032 Old South Ln
- 2032 Old South Ln
- 949 Woodcraft Dr
- 931 Woodcraft Dr
- 1036 Sweet Tree Ct
- 1034 Sweet Tree Ct
- 1035 Sweet Tree Ct
- 1053 Cottonwood Ct