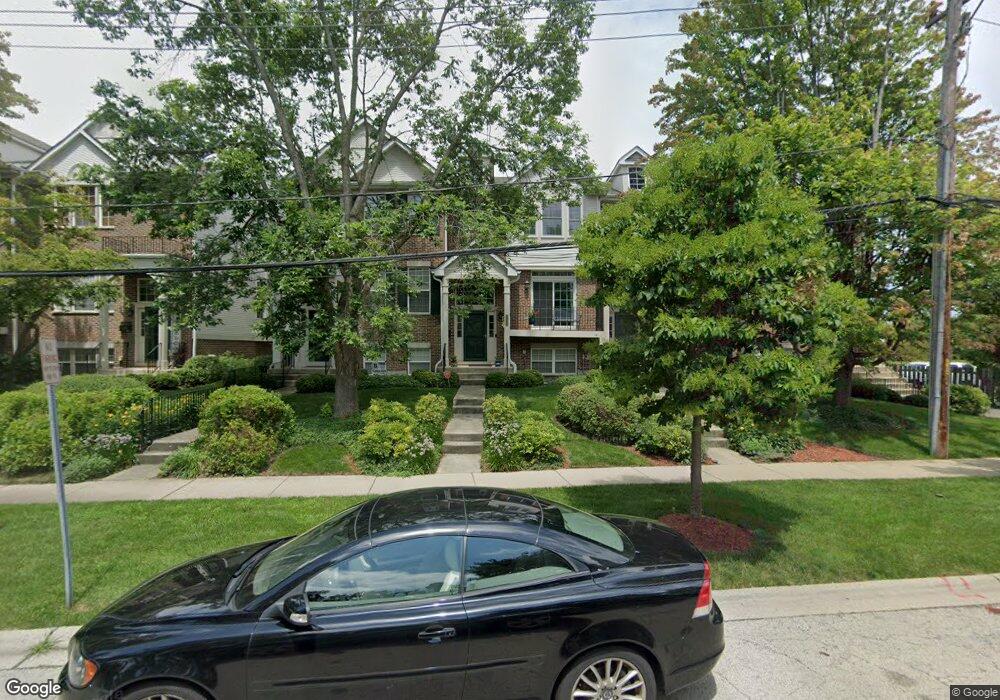
2102 Rugen Rd Glenview, IL 60026
The Glen NeighborhoodEstimated Value: $463,600 - $535,000
3
Beds
3
Baths
1,600
Sq Ft
$306/Sq Ft
Est. Value
About This Home
This home is located at 2102 Rugen Rd, Glenview, IL 60026 and is currently estimated at $489,900, approximately $306 per square foot. 2102 Rugen Rd is a home located in Cook County with nearby schools including Lyon Elementary School, Pleasant Ridge Elementary School, and Attea Middle School.
Ownership History
Date
Name
Owned For
Owner Type
Purchase Details
Closed on
Jun 15, 2015
Sold by
Kadolph Bridget Quinn
Bought by
Yoon Duck and Lee Sinae
Current Estimated Value
Home Financials for this Owner
Home Financials are based on the most recent Mortgage that was taken out on this home.
Original Mortgage
$279,200
Outstanding Balance
$212,319
Interest Rate
3.25%
Mortgage Type
Adjustable Rate Mortgage/ARM
Estimated Equity
$277,581
Purchase Details
Closed on
Sep 27, 2012
Sold by
Chicago Title Land Trust Company
Bought by
Kadolph Bridget Quinn and Bridget Quinn Kadolph Trust
Home Financials for this Owner
Home Financials are based on the most recent Mortgage that was taken out on this home.
Original Mortgage
$240,000
Interest Rate
3.25%
Mortgage Type
New Conventional
Purchase Details
Closed on
Dec 7, 2009
Sold by
Glynn William C
Bought by
Chicago Title Land Trust Company and Trust #8002353669
Create a Home Valuation Report for This Property
The Home Valuation Report is an in-depth analysis detailing your home's value as well as a comparison with similar homes in the area
Home Values in the Area
Average Home Value in this Area
Purchase History
| Date | Buyer | Sale Price | Title Company |
|---|---|---|---|
| Yoon Duck | $349,000 | Proper Title Llc | |
| Kadolph Bridget Quinn | $288,000 | Chicago Title Land Trust Com | |
| Chicago Title Land Trust Company | -- | None Available |
Source: Public Records
Mortgage History
| Date | Status | Borrower | Loan Amount |
|---|---|---|---|
| Open | Yoon Duck | $279,200 | |
| Previous Owner | Kadolph Bridget Quinn | $240,000 |
Source: Public Records
Tax History Compared to Growth
Tax History
| Year | Tax Paid | Tax Assessment Tax Assessment Total Assessment is a certain percentage of the fair market value that is determined by local assessors to be the total taxable value of land and additions on the property. | Land | Improvement |
|---|---|---|---|---|
| 2024 | $7,677 | $38,000 | $6,500 | $31,500 |
| 2023 | $7,438 | $38,000 | $6,500 | $31,500 |
| 2022 | $7,438 | $38,000 | $6,500 | $31,500 |
| 2021 | $6,532 | $29,575 | $1,736 | $27,839 |
| 2020 | $6,511 | $29,575 | $1,736 | $27,839 |
| 2019 | $6,064 | $32,501 | $1,736 | $30,765 |
| 2018 | $6,594 | $32,107 | $1,510 | $30,597 |
| 2017 | $6,432 | $32,107 | $1,510 | $30,597 |
| 2016 | $6,263 | $32,107 | $1,510 | $30,597 |
| 2015 | $5,996 | $27,800 | $1,208 | $26,592 |
| 2014 | $5,898 | $27,800 | $1,208 | $26,592 |
| 2013 | -- | $27,800 | $1,208 | $26,592 |
Source: Public Records
Map
Nearby Homes
- 1900 E Lake Ave
- 2156 Rugen Rd Unit A
- 1341 Greenwillow Ln Unit C
- 1342 Pine St
- 2121 Fir St
- 1220 Depot St Unit 305
- 1220 Depot St Unit 109
- 1220 Depot St Unit 409
- 1429 Pebblecreek Dr Unit 171
- 1752 Maclean Ct
- 2000 Chestnut Ave Unit 103
- 1508 Pebblecreek Dr Unit 14
- 1619 Patriot Blvd
- 2137 Glenview Rd
- 1735 Patriot Blvd
- 1847 Tanglewood Dr Unit 3B
- 2102 Rugen Rd
- 2102 Rugen Rd Unit B
- 2104 Rugen Rd
- 2104 Rugen Rd
- 2104 Rugen Rd Unit A
- 2100 Rugen Rd
- 2100 Rugen Rd
- 2100 Rugen Rd Unit B
- 2100A Rugen Rd
- 2106 Rugen Rd
- 2106 Rugen Rd
- 2106 Rugen Rd
- 2106A Rugen Rd
- 1414 Lehigh Ave Unit 1414
- 1414 Lehigh Ave Unit 1414
- 1414 Lehigh Ave Unit 1414
- 1414 Lehigh Ave Unit 1414
- 1414 Lehigh Ave Unit B2
- 1414 Lehigh Ave Unit 2B