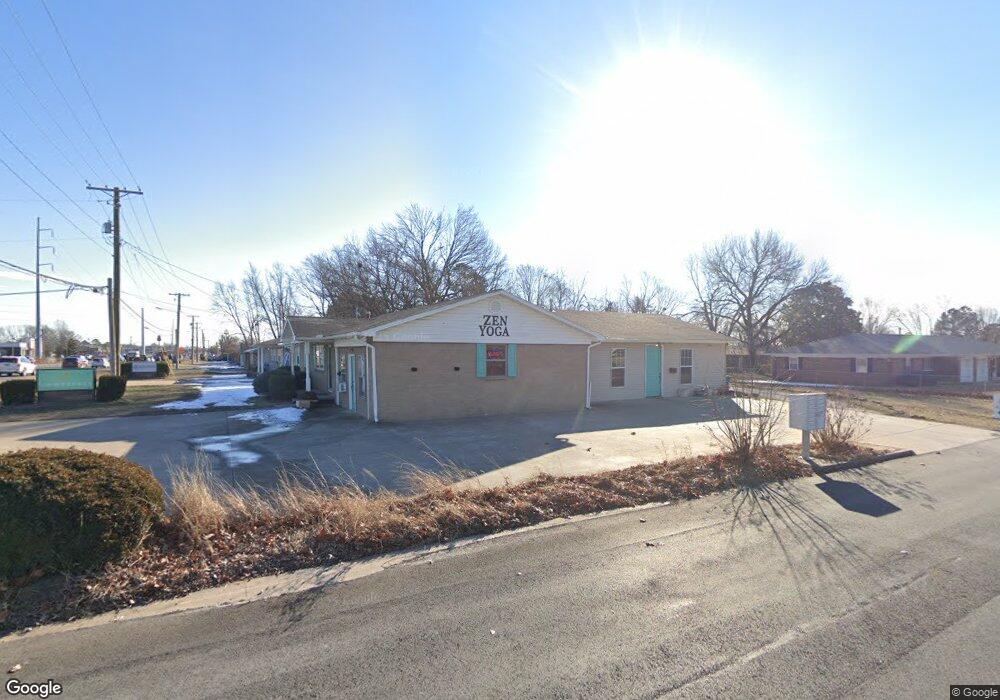
2102 SE 14th St Bentonville, AR 72712
Estimated Value: $308,038
--
Bed
--
Bath
2,905
Sq Ft
$106/Sq Ft
Est. Value
About This Home
This home is located at 2102 SE 14th St, Bentonville, AR 72712 and is currently estimated at $308,038, approximately $106 per square foot. 2102 SE 14th St is a home located in Benton County with nearby schools including Ruth Barker Middle School, R.E. Baker Elementary School, and Fulbright Junior High School.
Ownership History
Date
Name
Owned For
Owner Type
Purchase Details
Closed on
Apr 26, 2013
Sold by
3G Llc
Bought by
Serenity Homes Inc
Current Estimated Value
Home Financials for this Owner
Home Financials are based on the most recent Mortgage that was taken out on this home.
Original Mortgage
$162,350
Interest Rate
3.61%
Purchase Details
Closed on
Oct 21, 2011
Sold by
Sizemore Jerry N and Sizemore Lois Jeanette
Bought by
3G Llc
Purchase Details
Closed on
Aug 9, 2007
Sold by
Sizemore Jerry N and Sizemore Lois Jeanette
Bought by
Sizemore Jerry N and Sizemore Lois Jeanette
Purchase Details
Closed on
Jun 13, 2000
Bought by
Sizemore
Purchase Details
Closed on
Jun 8, 2000
Bought by
N and A
Purchase Details
Closed on
Oct 22, 1993
Bought by
Diffin
Purchase Details
Closed on
Sep 20, 1993
Bought by
Powell
Purchase Details
Closed on
Nov 19, 1991
Bought by
Powell and Powell Haywood
Purchase Details
Closed on
Nov 15, 1982
Bought by
Sturgeon
Create a Home Valuation Report for This Property
The Home Valuation Report is an in-depth analysis detailing your home's value as well as a comparison with similar homes in the area
Home Values in the Area
Average Home Value in this Area
Purchase History
| Date | Buyer | Sale Price | Title Company |
|---|---|---|---|
| Serenity Homes Inc | $191,000 | City Title & Closing Llc | |
| 3G Llc | $130,000 | Mercury Title Llc | |
| Sizemore Jerry N | -- | None Available | |
| Sizemore | $80,000 | -- | |
| N | -- | -- | |
| Diffin | $53,000 | -- | |
| Powell | -- | -- | |
| Powell | $52,000 | -- | |
| Sturgeon | $44,000 | -- |
Source: Public Records
Mortgage History
| Date | Status | Borrower | Loan Amount |
|---|---|---|---|
| Closed | Serenity Homes Inc | $162,350 |
Source: Public Records
Tax History Compared to Growth
Tax History
| Year | Tax Paid | Tax Assessment Tax Assessment Total Assessment is a certain percentage of the fair market value that is determined by local assessors to be the total taxable value of land and additions on the property. | Land | Improvement |
|---|---|---|---|---|
| 2025 | $4,841 | $78,683 | $38,299 | $40,384 |
| 2024 | $4,787 | $78,683 | $38,299 | $40,384 |
| 2023 | $4,352 | $70,420 | $36,520 | $33,900 |
| 2022 | $4,225 | $70,420 | $36,520 | $33,900 |
| 2021 | $3,860 | $70,420 | $36,520 | $33,900 |
| 2020 | $3,543 | $55,620 | $22,580 | $33,040 |
| 2019 | $3,543 | $55,620 | $22,580 | $33,040 |
| 2018 | $3,543 | $55,620 | $22,580 | $33,040 |
| 2017 | $2,983 | $55,620 | $22,580 | $33,040 |
| 2016 | $2,983 | $55,620 | $22,580 | $33,040 |
| 2015 | $2,716 | $43,950 | $14,070 | $29,880 |
| 2014 | $2,716 | $34,230 | $14,070 | $20,160 |
Source: Public Records
Map
Nearby Homes
- 2302 & 2301 SE 14th 15th St
- 1126 Lockheed St
- 1902 Lawrence St
- 1126 Lockheed St
- 1710 SE Flynt St
- 2401 SE 16th St
- 1100 Lockheed St
- 1102 Lockheed St
- 1602 SE P St
- 2301 Beth Ln
- 906 Convair St
- 2401 SE 9th St
- 900 Convair St
- 2202 Del White Dr
- 1908 and 1910 SE J St
- 0 SE J St
- 1203 SE 21st St
- 929 SE 10th St
- 814 SE Jon Dr
- 825 SE H St
- 2104 SE 14th St
- 1405 SE Sunrise St
- 1405 SE Sunrise St
- 2103 SE 15th St
- 2008 SE 14th St
- 2105 SE 15th St
- 1404 SE Sunrise St
- 2202 SE 14th St
- 2202 SW 14th St
- 2000 SE 14th St
- 2000 SE 14th St
- 2201 SE 15th St
- 1308 Lockheed St
- 2104 SE 15th St
- 1310 Lockheed St
- 1406 SE Sunrise St
- 2106 SE 15th St
- 1308 Convair St
- 1407 SE S St
- 2202 SE 15th St