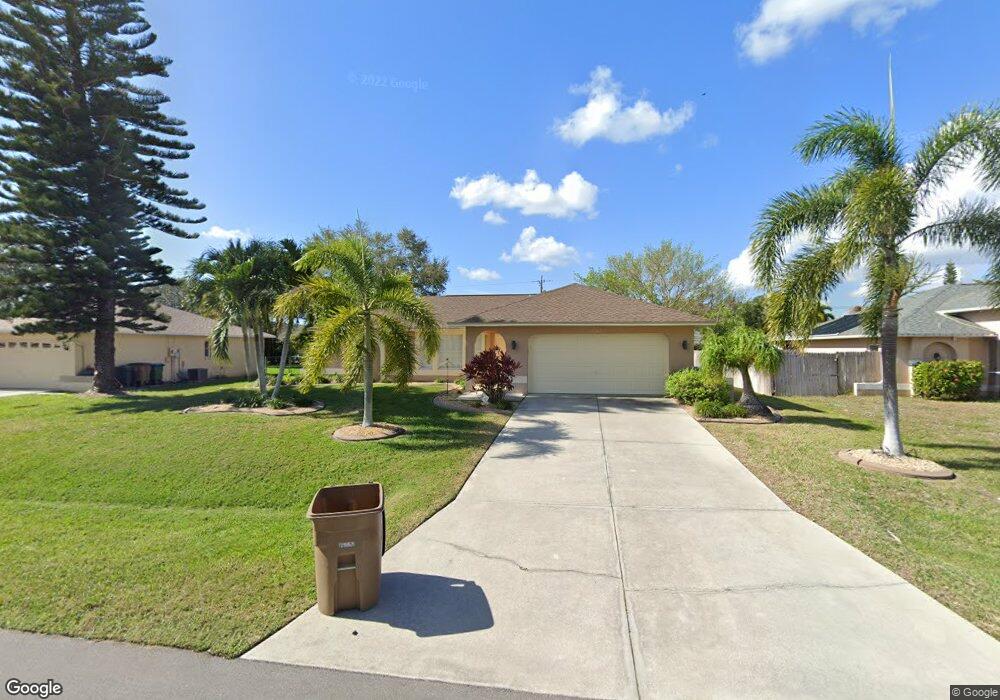
2102 SE 8th Place Cape Coral, FL 33990
Hancock NeighborhoodEstimated Value: $269,000 - $292,000
3
Beds
2
Baths
1,365
Sq Ft
$207/Sq Ft
Est. Value
About This Home
This home is located at 2102 SE 8th Place, Cape Coral, FL 33990 and is currently estimated at $282,983, approximately $207 per square foot. 2102 SE 8th Place is a home located in Lee County with nearby schools including Caloosa Elementary School, Cape Elementary School, and Tropic Isles Elementary School.
Ownership History
Date
Name
Owned For
Owner Type
Purchase Details
Closed on
Nov 9, 2020
Sold by
Dinda Rhonda
Bought by
Dinda Rhonda and Rhonda Dinda Revocable Living
Current Estimated Value
Purchase Details
Closed on
Dec 26, 2012
Sold by
Stankovich Walter and Stankovich Sherry
Bought by
Dinda Rhonda
Purchase Details
Closed on
Oct 5, 2009
Sold by
Gates James H and Gates Melissa
Bought by
Stankovich Walter and Stankovich Sherry
Purchase Details
Closed on
Mar 18, 2005
Sold by
Crowley Daniel B and Crowley Julie Ann
Bought by
Gates James H and Gates Melissa
Home Financials for this Owner
Home Financials are based on the most recent Mortgage that was taken out on this home.
Original Mortgage
$168,500
Interest Rate
8.25%
Mortgage Type
Unknown
Purchase Details
Closed on
Apr 9, 2003
Sold by
Baywood Const Inc
Bought by
Crowley Daniel B and Crowley Julie Ann
Purchase Details
Closed on
Jun 3, 2002
Sold by
Consol Midwest Inv
Bought by
Baywood Const Inc
Create a Home Valuation Report for This Property
The Home Valuation Report is an in-depth analysis detailing your home's value as well as a comparison with similar homes in the area
Home Values in the Area
Average Home Value in this Area
Purchase History
| Date | Buyer | Sale Price | Title Company |
|---|---|---|---|
| Dinda Rhonda | -- | Accommodation | |
| Dinda Rhonda | -- | None Available | |
| Stankovich Walter | $75,000 | Talon Title Services Llc | |
| Gates James H | $168,500 | First American Title Ins Co | |
| Crowley Daniel B | $129,900 | -- | |
| Baywood Const Inc | $16,000 | -- |
Source: Public Records
Mortgage History
| Date | Status | Borrower | Loan Amount |
|---|---|---|---|
| Previous Owner | Gates James H | $168,500 |
Source: Public Records
Tax History Compared to Growth
Tax History
| Year | Tax Paid | Tax Assessment Tax Assessment Total Assessment is a certain percentage of the fair market value that is determined by local assessors to be the total taxable value of land and additions on the property. | Land | Improvement |
|---|---|---|---|---|
| 2025 | $1,898 | $110,035 | -- | -- |
| 2024 | $1,782 | $106,934 | -- | -- |
| 2023 | $1,782 | $103,819 | $0 | $0 |
| 2022 | $1,599 | $100,795 | $0 | $0 |
| 2021 | $1,551 | $162,820 | $33,148 | $129,672 |
| 2020 | $1,542 | $96,508 | $0 | $0 |
| 2019 | $1,482 | $94,338 | $0 | $0 |
| 2018 | $1,460 | $92,579 | $0 | $0 |
| 2017 | $1,437 | $90,675 | $0 | $0 |
| 2016 | $1,379 | $117,390 | $19,549 | $97,841 |
| 2015 | $1,360 | $101,294 | $16,430 | $84,864 |
| 2014 | -- | $99,594 | $16,386 | $83,208 |
| 2013 | -- | $86,200 | $12,021 | $74,179 |
Source: Public Records
Map
Nearby Homes
- 2114 SE 8th Place
- 2016 Academy Blvd
- 908 SE 21st Terrace
- 1942 SE 8th Place
- 622 SE 20th St
- 1449 SE 22nd St
- 915 SE 20th St
- 910 SE 19th Ln
- 624 SE 19th Ln
- 627 SE 22nd Terrace
- 1914 Country Club Blvd
- 2201 SE 10th Ave
- 1927 SE 10th Ave
- 610 SE 22nd Terrace
- 1903 SE 10th Ave
- 1922 SE 10th Place
- 624 SE 23rd Terrace
- 911 SE 18th Terrace
- 2326 SE 8th Ave
- 1910 SE 10th Place
- 2106 SE 8th Place
- 2024 SE 8th Place
- 2103 SE 8th Ave
- 2021 SE 8th Ave
- 2110 SE 8th Place Unit 11
- 2110 SE 8th Place
- 2020 SE 8th Place
- 2107 SE 8th Ave
- 2103 SE 8th Place
- 2017 SE 8th Ave
- 2107 SE 8th Place
- 2111 SE 8th Ave
- 2019 SE 8th Place
- 2016 SE 8th Place
- 2111 SE 8th Place
- 2011 SE 8th Ave
- 2102 Country Club Blvd
- 2015 SE 8th Place
- 2104 SE 8th Ave
- 2115 SE 8th Ave