Estimated Value: $311,000 - $381,000
3
Beds
2
Baths
1,312
Sq Ft
$261/Sq Ft
Est. Value
About This Home
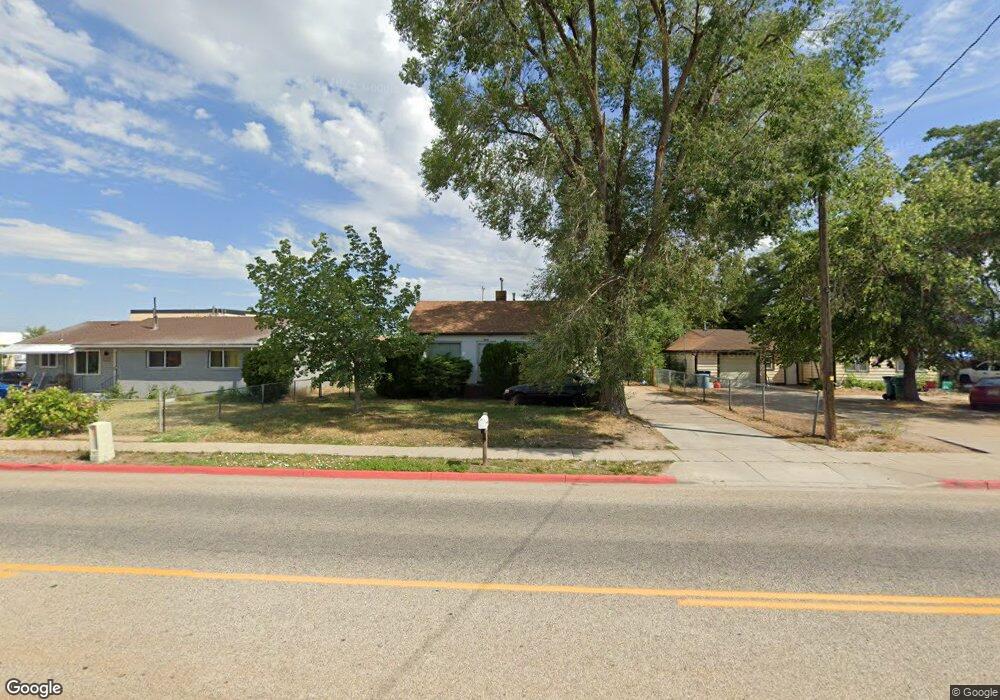
This home is located at 2102 W 4800 S, Roy, UT 84067 and is currently estimated at $342,234, approximately $260 per square foot. 2102 W 4800 S is a home located in Weber County with nearby schools including North Park School, Sand Ridge Junior High School, and Roy High School.
Ownership History
Date
Name
Owned For
Owner Type
Purchase Details
Closed on
Mar 23, 2023
Sold by
Hernandez Ashton Matthew and Evans Joseph Vincent
Bought by
Frecker Neil Dean
Current Estimated Value
Home Financials for this Owner
Home Financials are based on the most recent Mortgage that was taken out on this home.
Original Mortgage
$300,700
Outstanding Balance
$291,578
Interest Rate
6.32%
Mortgage Type
New Conventional
Estimated Equity
$50,656
Purchase Details
Closed on
Jan 19, 2022
Sold by
Revocable Trust
Bought by
Hernandez Ashton Matthew and Evans Joseph Vincent
Home Financials for this Owner
Home Financials are based on the most recent Mortgage that was taken out on this home.
Original Mortgage
$289,987
Interest Rate
3.11%
Mortgage Type
New Conventional
Purchase Details
Closed on
Jun 21, 2021
Sold by
Croft Ruth G
Bought by
Croft Alan P and Ruth G Croft Revocable Trust
Create a Home Valuation Report for This Property
The Home Valuation Report is an in-depth analysis detailing your home's value as well as a comparison with similar homes in the area
Home Values in the Area
Average Home Value in this Area
Purchase History
| Date | Buyer | Sale Price | Title Company |
|---|---|---|---|
| Frecker Neil Dean | -- | Inwest Title | |
| Hernandez Ashton Matthew | -- | Inwest Title | |
| Croft Alan P | -- | None Available |
Source: Public Records
Mortgage History
| Date | Status | Borrower | Loan Amount |
|---|---|---|---|
| Open | Frecker Neil Dean | $300,700 | |
| Previous Owner | Hernandez Ashton Matthew | $289,987 |
Source: Public Records
Tax History Compared to Growth
Tax History
| Year | Tax Paid | Tax Assessment Tax Assessment Total Assessment is a certain percentage of the fair market value that is determined by local assessors to be the total taxable value of land and additions on the property. | Land | Improvement |
|---|---|---|---|---|
| 2025 | $1,818 | $273,958 | $111,600 | $162,358 |
| 2024 | $1,778 | $148,497 | $61,380 | $87,117 |
| 2023 | $1,565 | $128,699 | $58,732 | $69,967 |
| 2022 | $1,822 | $158,950 | $53,711 | $105,239 |
| 2021 | $1,562 | $224,000 | $12,499 | $211,501 |
| 2020 | $1,538 | $204,001 | $12,499 | $191,502 |
| 2019 | $1,442 | $178,998 | $37,215 | $141,783 |
| 2018 | $1,396 | $163,000 | $32,517 | $130,483 |
| 2017 | $1,235 | $133,000 | $30,763 | $102,237 |
| 2016 | $1,192 | $68,929 | $18,153 | $50,776 |
| 2015 | $1,046 | $60,939 | $18,153 | $42,786 |
| 2014 | $1,017 | $58,302 | $18,153 | $40,149 |
Source: Public Records
Map
Nearby Homes
- 2067 W 4750 S
- 2107 W 4750 S
- 4848 S 2125 W
- 2153 W 4800 S
- 2038 W 4600 S
- 2179 W 4975 S
- 4642 S 1900 W Unit 41
- 2259 W 4525 S
- 5006 S 1800 W
- 4475 S 1975 W
- 4602 Hathaway Dr
- 1789 W 5000 S
- 4536 S 1900 W Unit 12
- 1825 W 4500 S Unit 101
- 1789 W 5050 S
- 1765 W 5000 S
- 2082 W 4450 S
- 1777 W 5050 S
- 1766 W 4575 S
- 1758 W 5025 S