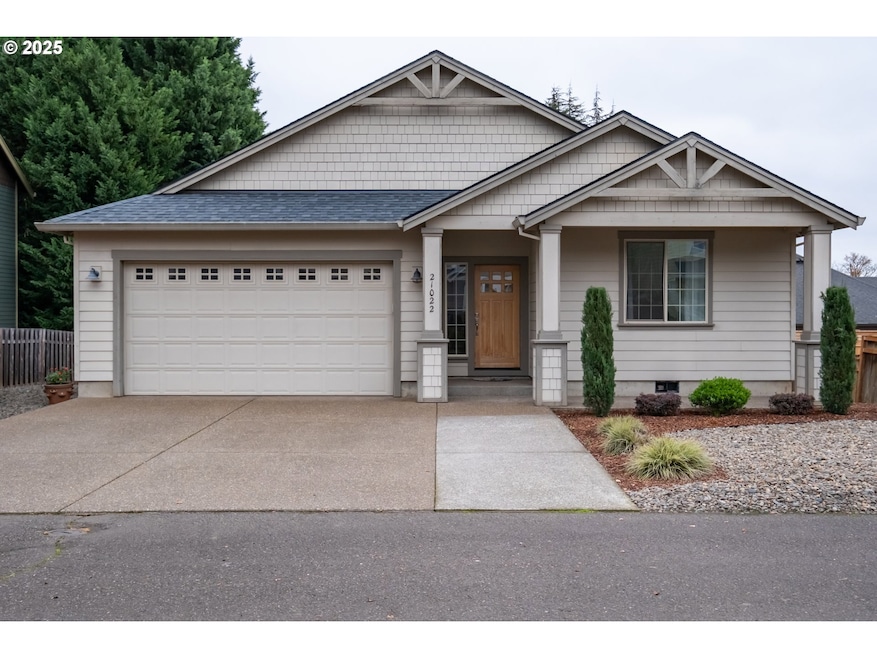
21022 Jennymarie Ln NE Aurora, OR 97002
Estimated payment $3,506/month
Highlights
- RV Access or Parking
- Private Yard
- Cul-De-Sac
- Contemporary Architecture
- No HOA
- 4-minute walk to Aurora City Park
About This Home
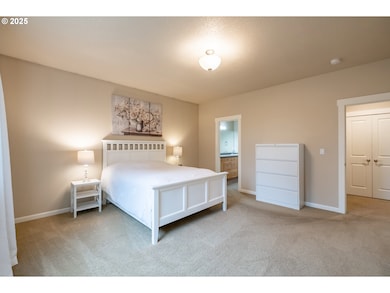
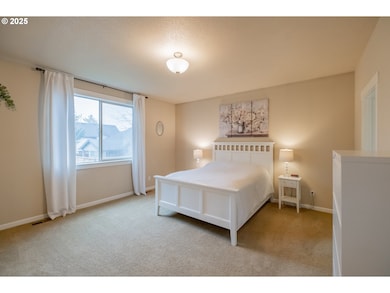
This had to find 3 bed 2 bath walk in primary closet, in Aurora is close to down town Historical antique shops and short commute to I 5.Quite neighbor hood on a deed-end street, with fenced yard, lots of storge. Additional Parking call for more information.

Home Details
Home Type
- Single Family
Est. Annual Taxes
- $5,110
Year Built
- Built in 2014
Lot Details
- 7,840 Sq Ft Lot
- Cul-De-Sac
- Fenced
- Private Yard
- Property is zoned R1
Parking
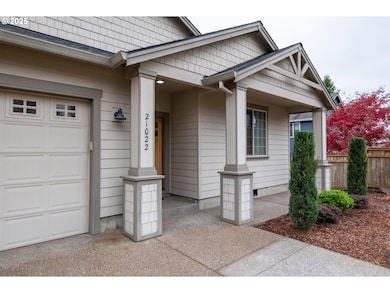
- 2 Car Attached Garage
- Driveway
- RV Access or Parking
Home Design
- Contemporary Architecture
- Composition Roof
- Lap Siding
- Concrete Perimeter Foundation
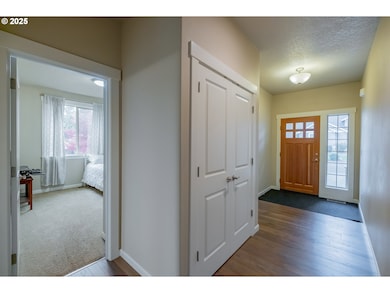
Interior Spaces
- 1,751 Sq Ft Home
- 1-Story Property
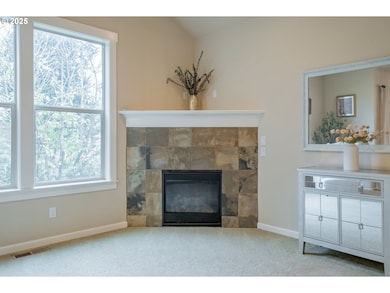
- Gas Fireplace
- Vinyl Clad Windows
- Family Room
- Living Room
- Dining Room
- Crawl Space
- Laundry Room
Kitchen
- Range Hood
- Dishwasher
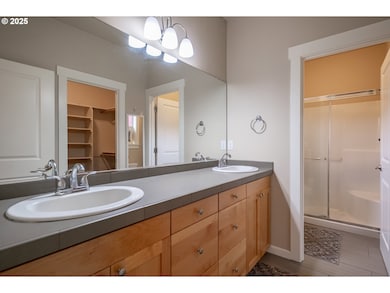
Bedrooms and Bathrooms
- 3 Bedrooms
- 2 Full Bathrooms
Accessible Home Design
- Accessibility Features
- Level Entry For Accessibility
Outdoor Features
- Covered Deck
Schools
- North Marion Elementary And Middle School
- North Marion High School
Utilities
- No Cooling
- Forced Air Heating System
- Gas Water Heater
Community Details
- No Home Owners Association
Listing and Financial Details
- Assessor Parcel Number 339289
Map
Home Values in the Area
Average Home Value in this Area
Tax History
| Year | Tax Paid | Tax Assessment Tax Assessment Total Assessment is a certain percentage of the fair market value that is determined by local assessors to be the total taxable value of land and additions on the property. | Land | Improvement |
|---|---|---|---|---|
| 2025 | $4,933 | $302,450 | -- | -- |
| 2024 | $4,933 | $293,650 | -- | -- |
| 2023 | $4,383 | $285,100 | $0 | $0 |
| 2022 | $4,385 | $276,800 | $0 | $0 |
| 2021 | $4,267 | $268,740 | $0 | $0 |
| 2020 | $4,152 | $260,920 | $0 | $0 |
| 2019 | $4,058 | $253,330 | $0 | $0 |
| 2018 | $3,963 | $0 | $0 | $0 |
| 2017 | $3,752 | $0 | $0 | $0 |
| 2016 | $3,685 | $0 | $0 | $0 |
| 2015 | $3,629 | $0 | $0 | $0 |
| 2014 | $1,049 | $0 | $0 | $0 |
Property History
| Date | Event | Price | List to Sale | Price per Sq Ft |
|---|---|---|---|---|
| 11/13/2025 11/13/25 | For Sale | $585,000 | -- | $334 / Sq Ft |
Purchase History
| Date | Type | Sale Price | Title Company |
|---|---|---|---|
| Warranty Deed | $279,000 | Fidelity National Title | |
| Warranty Deed | $65,000 | Chicago Title Company Oregon | |
| Interfamily Deed Transfer | -- | None Available |
Mortgage History
| Date | Status | Loan Amount | Loan Type |
|---|---|---|---|
| Open | $284,693 | New Conventional | |
| Previous Owner | $210,000 | New Conventional |
Source: Regional Multiple Listing Service (RMLS)
MLS Number: 164256000
APN: 339289
Disclaimer: Certain information contained herein is derived from information provided by parties other than Homes.com. All information provided is deemed reliable, but is not guaranteed to be accurate and should be independently verified.
![]() The content relating to real estate for sale on this web site comes in part from the IDX program of the RMLS™ of Portland, Oregon. Real estate listings held by brokerage firms other than Ten-X are marked with the RMLS™ logo, and detailed information about these properties includes the names of the listing brokers. Listing content is copyright © 2025 RMLS™, Portland, Oregon. Some properties which appear for sale on this web site may subsequently have sold or may no longer be available. All information provided is deemed reliable but is not guaranteed and should be independently verified.
The content relating to real estate for sale on this web site comes in part from the IDX program of the RMLS™ of Portland, Oregon. Real estate listings held by brokerage firms other than Ten-X are marked with the RMLS™ logo, and detailed information about these properties includes the names of the listing brokers. Listing content is copyright © 2025 RMLS™, Portland, Oregon. Some properties which appear for sale on this web site may subsequently have sold or may no longer be available. All information provided is deemed reliable but is not guaranteed and should be independently verified.
- 14713 Ottaway Rd NE
- 20870 Yosemite St NE
- 20800 Yosemite St NE
- 20923 Filbert St NE
- 14750 Orchard St NE
- 14665 Orchard Ave NE
- 21497 Highway 99e NE
- 21520 Main St NE
- 15109 2nd St NE
- 26026 S Meridian Rd
- 21358 Oak Ln NE
- 21984 Camellia Ct NE
- 21150 Boones Ferry Rd NE
- 27200 S Barlow Rd
- 13424 Ehlen Rd NE
- 6939 S Zimmerman Rd
- 12602 Fry Rd NE
- 19601 Boones Ferry Rd NE
- 29497 S Meridian Rd
- 1655 S Elm St Unit 2
- 847 NW 1st Ave
- 621 N Douglas St
- 111 NW 2nd Ave
- 800 N Pine St
- 1628 NE 10th Place
- 1200 NE Territorial Rd
- 1203 NE Territorial Rd
- 2040 N Redwood St
- 30050 SW Town Center Loop W
- 30480 SW Boones Ferry Rd
- 29697 SW Rose Ln
- 29700 SW Courtside Dr Unit 43
- 29796 SW Montebello Dr
- 10305 SW Wilsonville Rd
- 29252 SW Tami Loop
- 7875 SW Vlahos Dr
- 2145 Molalla Rd
- 2145 Molalla Rd Unit N203.1411532
- 2145 Molalla Rd Unit B202.1411537
- 2145 Molalla Rd Unit H203.1411540