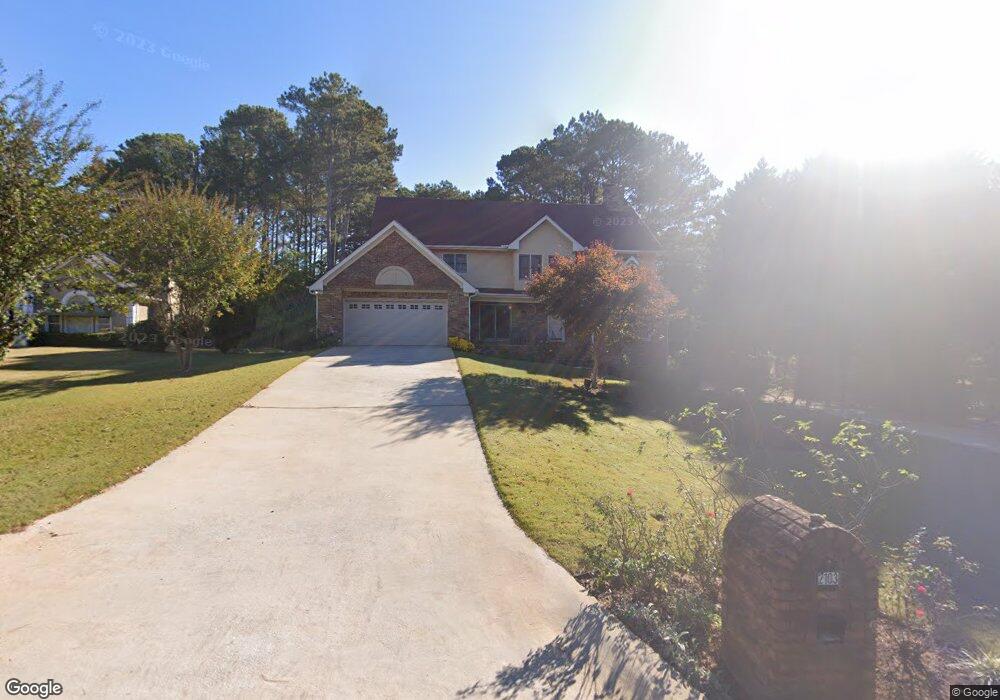
2103 Bishop Ct SE Conyers, GA 30013
Estimated Value: $338,000 - $388,000
4
Beds
3
Baths
2,753
Sq Ft
$130/Sq Ft
Est. Value
About This Home
This home is located at 2103 Bishop Ct SE, Conyers, GA 30013 and is currently estimated at $357,910, approximately $130 per square foot. 2103 Bishop Ct SE is a home located in Rockdale County with nearby schools including Flat Shoals Elementary School, Memorial Middle School, and Salem High School.
Ownership History
Date
Name
Owned For
Owner Type
Purchase Details
Closed on
Feb 16, 2011
Sold by
Federal Natl Mtg Assn Fnma
Bought by
Morrison Rose
Current Estimated Value
Home Financials for this Owner
Home Financials are based on the most recent Mortgage that was taken out on this home.
Original Mortgage
$70,000
Outstanding Balance
$47,626
Interest Rate
4.66%
Mortgage Type
New Conventional
Estimated Equity
$310,284
Purchase Details
Closed on
Apr 6, 2010
Sold by
Bac Home Loans Servicing Lp
Bought by
Federal Natl Mtg Assn Fnma
Purchase Details
Closed on
Dec 28, 2004
Sold by
Gigliotti Ernest J
Bought by
Mebreku Kewondbelay A
Home Financials for this Owner
Home Financials are based on the most recent Mortgage that was taken out on this home.
Original Mortgage
$37,140
Interest Rate
5.71%
Mortgage Type
Stand Alone Refi Refinance Of Original Loan
Create a Home Valuation Report for This Property
The Home Valuation Report is an in-depth analysis detailing your home's value as well as a comparison with similar homes in the area
Home Values in the Area
Average Home Value in this Area
Purchase History
| Date | Buyer | Sale Price | Title Company |
|---|---|---|---|
| Morrison Rose | $126,000 | -- | |
| Federal Natl Mtg Assn Fnma | $167,293 | -- | |
| Bac Home Loans Servicing Lp | $167,293 | -- | |
| Mebreku Kewondbelay A | $185,700 | -- |
Source: Public Records
Mortgage History
| Date | Status | Borrower | Loan Amount |
|---|---|---|---|
| Open | Morrison Rose | $70,000 | |
| Previous Owner | Mebreku Kewondbelay A | $37,140 |
Source: Public Records
Tax History Compared to Growth
Tax History
| Year | Tax Paid | Tax Assessment Tax Assessment Total Assessment is a certain percentage of the fair market value that is determined by local assessors to be the total taxable value of land and additions on the property. | Land | Improvement |
|---|---|---|---|---|
| 2024 | $3,760 | $151,520 | $30,880 | $120,640 |
| 2023 | $2,997 | $126,640 | $26,360 | $100,280 |
| 2022 | $2,838 | $120,440 | $26,360 | $94,080 |
| 2021 | $2,617 | $105,080 | $20,000 | $85,080 |
| 2020 | $2,394 | $94,200 | $17,480 | $76,720 |
| 2019 | $2,044 | $80,880 | $11,960 | $68,920 |
| 2018 | $1,984 | $78,520 | $11,960 | $66,560 |
| 2017 | $1,895 | $74,840 | $11,960 | $62,880 |
| 2016 | $1,251 | $57,600 | $7,800 | $49,800 |
| 2015 | $1,253 | $57,600 | $7,800 | $49,800 |
| 2014 | $1,122 | $57,600 | $7,800 | $49,800 |
| 2013 | -- | $50,400 | $9,125 | $41,274 |
Source: Public Records
Map
Nearby Homes
- 1260 White Oak St SE
- 1896 Poplar St SE
- 2165 Old Salem Rd SE
- 2259 Old Salem Rd SE
- 1408 Aramore Dr SE
- 1328 White Oak St SE
- 1368 White Oak St SE Unit 2
- 1390 White Oak St SE
- 2193 Kings Forest Dr SE
- 1242 Saxony Dr SE
- 0 Georgia 20 Unit 10439576
- 2215 Kings Forest Dr SE
- 2225 Kings Forest Dr SE
- 1679 Oak Forest Dr SE
- 2235 Kings Forest Dr SE
- 675 Hunting Creek Ln SE
- 661 Browning Ln SE
- 664 Browning Ln SE
- 952 Jimson Dr SE
- 1625 Old Salem Rd SE
- 2105 Bishop Ct SE
- 1231 Lambeth Way SE
- 1229 Lambeth Way SE
- 0 Bishop Ct SE Unit 8149394
- 1233 Lambeth Way SE Unit 59
- 1233 Lambeth Way SE
- 2107 Bishop Ct SE
- 1227 Lambeth Way SE
- 2104 Bishop Ct SE
- 0 Lambeth Way SE Unit 7377966
- 0 Lambeth Way SE Unit 7257862
- 0 Lambeth Way SE Unit 8725556
- 0 Lambeth Way SE Unit 8321289
- 0 Lambeth Way SE Unit 3167132
- 0 Lambeth Way SE Unit 8270289
- 0 Lambeth Way SE Unit 8167495
- 0 Lambeth Way SE Unit 7513194
- 0 Lambeth Way SE Unit 7032328
- 0 Lambeth Way SE Unit 8797421
- 0 Lambeth Way SE Unit 8824935