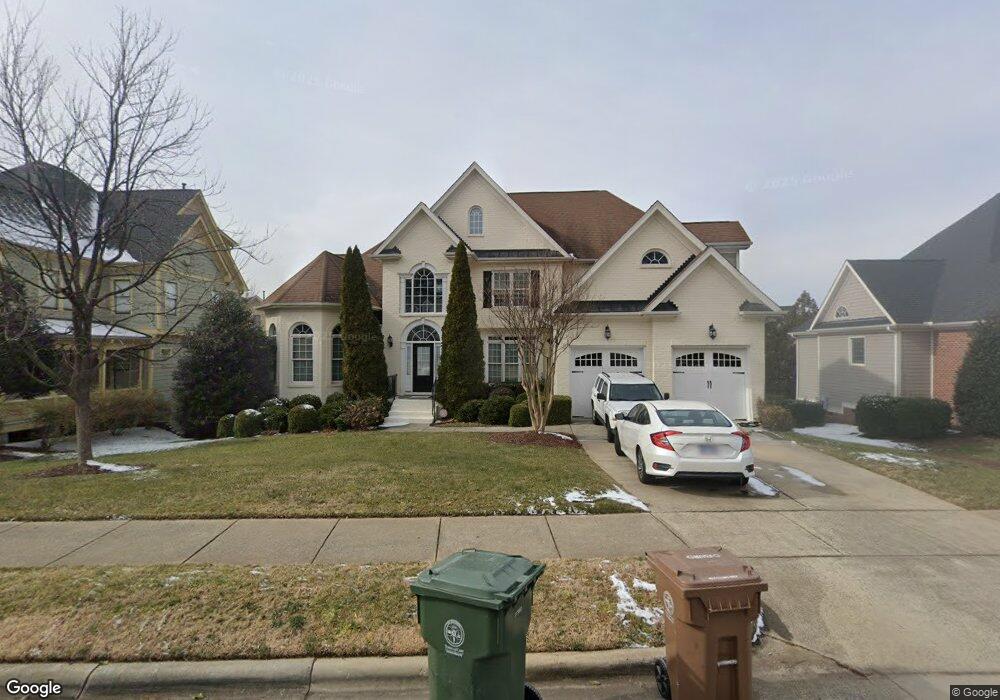
2103 Cameron Pond Dr Unit Lot43 Cary, NC 27519
Carpenter NeighborhoodEstimated Value: $1,210,000 - $1,293,619
4
Beds
4
Baths
3,887
Sq Ft
$326/Sq Ft
Est. Value
About This Home
This home is located at 2103 Cameron Pond Dr Unit Lot43, Cary, NC 27519 and is currently estimated at $1,266,155, approximately $325 per square foot. 2103 Cameron Pond Dr Unit Lot43 is a home located in Wake County with nearby schools including Carpenter Elementary, Alston Ridge Middle School, and Panther Creek High School.
Ownership History
Date
Name
Owned For
Owner Type
Purchase Details
Closed on
Jan 5, 2017
Sold by
Yacovone Richard A and Yacovone Anna Maria
Bought by
Yacovone Richard Anthony and Yacovone Anna Maria
Current Estimated Value
Purchase Details
Closed on
Oct 1, 2014
Sold by
Piglia Pascal L
Bought by
Yacovone Richard A and Yacovone Anna Maria
Home Financials for this Owner
Home Financials are based on the most recent Mortgage that was taken out on this home.
Original Mortgage
$375,000
Outstanding Balance
$271,026
Interest Rate
2.62%
Mortgage Type
Adjustable Rate Mortgage/ARM
Estimated Equity
$995,129
Purchase Details
Closed on
Jan 16, 2013
Sold by
Poythress Homes Inc
Bought by
Piglia Pascall
Purchase Details
Closed on
Jul 18, 2005
Sold by
Pythress Homes Inc
Bought by
Poythress Homes Inc
Create a Home Valuation Report for This Property
The Home Valuation Report is an in-depth analysis detailing your home's value as well as a comparison with similar homes in the area
Home Values in the Area
Average Home Value in this Area
Purchase History
| Date | Buyer | Sale Price | Title Company |
|---|---|---|---|
| Yacovone Richard Anthony | -- | None Available | |
| Yacovone Richard A | $645,000 | None Available | |
| Piglia Pascall | $575,000 | None Available | |
| Poythress Homes Inc | -- | None Available |
Source: Public Records
Mortgage History
| Date | Status | Borrower | Loan Amount |
|---|---|---|---|
| Open | Yacovone Richard A | $375,000 |
Source: Public Records
Tax History Compared to Growth
Tax History
| Year | Tax Paid | Tax Assessment Tax Assessment Total Assessment is a certain percentage of the fair market value that is determined by local assessors to be the total taxable value of land and additions on the property. | Land | Improvement |
|---|---|---|---|---|
| 2025 | $9,707 | $1,130,237 | $250,000 | $880,237 |
| 2024 | $9,497 | $1,130,237 | $250,000 | $880,237 |
| 2023 | $6,527 | $649,404 | $145,000 | $504,404 |
| 2022 | $6,284 | $649,404 | $145,000 | $504,404 |
| 2021 | $5,207 | $649,404 | $145,000 | $504,404 |
| 2020 | $6,189 | $649,404 | $145,000 | $504,404 |
| 2019 | $7,336 | $683,260 | $148,000 | $535,260 |
| 2018 | $6,883 | $662,895 | $148,000 | $514,895 |
| 2017 | $6,417 | $662,895 | $148,000 | $514,895 |
| 2016 | $0 | $646,295 | $148,000 | $498,295 |
| 2015 | $1,328 | $691,517 | $129,000 | $562,517 |
| 2014 | -- | $691,517 | $129,000 | $562,517 |
Source: Public Records
Map
Nearby Homes
- 307 Beacon Falls Ct
- 2207 Cameron Pond Dr
- 1534 Glenwater Dr
- 2728 Cameron Pond Dr
- 421 Gilpin Way
- 1404 Glenwater Dr
- 405 Gilpin Way
- 1419 Glenwater Dr
- 1413 Glenwater Dr
- 1624 Pantego Trail
- 738 Channing Park Cir
- 2001 Summerhouse Rd
- 8027 Windthorn Place
- 1014 Summerhouse Rd
- 254 Michigan Ave
- 6972 Doddridge Ln Unit 9
- 6972 Doddridge Ln
- 128 Dove Cottage Ln
- 235 Michigan Ave
- 6966 Doddridge Ln
- 2103 Cameron Pond Dr
- 2103 Cameron Pond Dr Unit L43
- 2101 Cameron Pond Dr
- 2105 Cameron Pond Dr
- 2105 Cameron Pond Dr Unit Lot42
- 309 Beacon Falls Ct Unit L38
- 309 Beacon Falls Ct
- 702 Magalloway Dr
- 307 Beacon Falls Ct Unit Lt39
- 2104 Cameron Pond Dr
- 2102 Cameron Pond Dr
- 305 Beacon Falls Ct
- 305 Beacon Falls Ct Unit Lt40
- 2106 Cameron Pond Dr
- 301 Beacon Falls Ct
- 301 Beacon Falls Ct Unit Lot41
- 2100 Cameron Pond Dr
- 2100 Cameron Pond Dr Unit Lot64
- 311 Beacon Falls Ct
- 311 Beacon Falls Ct Unit Lt37