Estimated Value: $130,000 - $166,000
1
Bed
1
Bath
873
Sq Ft
$165/Sq Ft
Est. Value
About This Home
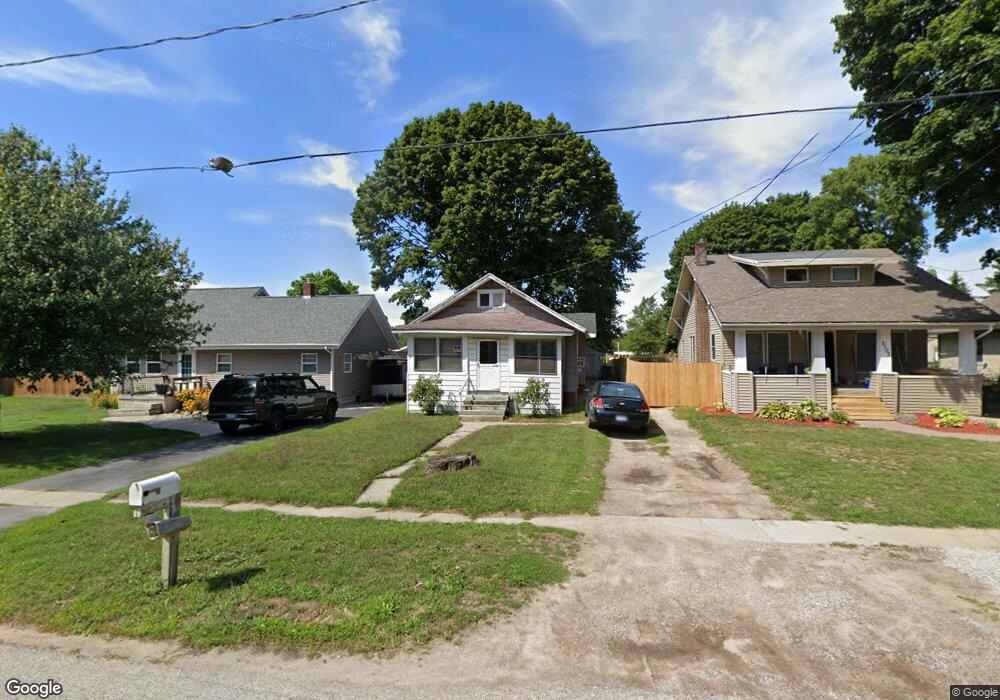
This home is located at 2103 Delhi St NE, Holt, MI 48842 and is currently estimated at $143,703, approximately $164 per square foot. 2103 Delhi St NE is a home located in Ingham County with nearby schools including Elliott Elementary School, Hope Middle School, and Holt Junior High School.
Ownership History
Date
Name
Owned For
Owner Type
Purchase Details
Closed on
Feb 15, 2022
Sold by
Bochenek Robert W
Bought by
Ryan Dedie J
Current Estimated Value
Purchase Details
Closed on
Jan 6, 2021
Sold by
Bochenek Joseph Emil
Bought by
Ryan Dedie J
Purchase Details
Closed on
Sep 7, 2017
Sold by
Ward Beth Ann
Bought by
Ryan Dedij
Purchase Details
Closed on
May 8, 2017
Sold by
Ward Beth Ann
Bought by
Ward Beth Ann
Purchase Details
Closed on
Oct 14, 2013
Sold by
Bochenek Robert
Bought by
Bochenek Daniel
Purchase Details
Closed on
Feb 20, 2009
Sold by
Lee Josephine E and Lee Adam L
Bought by
Lee Josephine E and Bochenek Robert W
Create a Home Valuation Report for This Property
The Home Valuation Report is an in-depth analysis detailing your home's value as well as a comparison with similar homes in the area
Home Values in the Area
Average Home Value in this Area
Purchase History
| Date | Buyer | Sale Price | Title Company |
|---|---|---|---|
| Ryan Dedie J | -- | None Listed On Document | |
| Ryan Dedie J | -- | None Available | |
| Ryan Dedij | -- | None Available | |
| Ward Beth Ann | -- | None Available | |
| Bochenek Daniel | -- | None Available | |
| Lee Josephine E | -- | None Available |
Source: Public Records
Tax History Compared to Growth
Tax History
| Year | Tax Paid | Tax Assessment Tax Assessment Total Assessment is a certain percentage of the fair market value that is determined by local assessors to be the total taxable value of land and additions on the property. | Land | Improvement |
|---|---|---|---|---|
| 2025 | $1,947 | $56,000 | $13,800 | $42,200 |
| 2024 | $5 | $53,400 | $12,000 | $41,400 |
| 2023 | $2,385 | $46,900 | $8,700 | $38,200 |
| 2022 | $2,140 | $38,000 | $8,700 | $29,300 |
| 2021 | $2,080 | $35,200 | $6,600 | $28,600 |
| 2020 | $2,018 | $34,600 | $6,600 | $28,000 |
| 2019 | $1,993 | $31,600 | $6,100 | $25,500 |
| 2018 | $1,988 | $32,700 | $6,100 | $26,600 |
| 2017 | $1,592 | $32,700 | $6,100 | $26,600 |
| 2016 | $1,532 | $33,100 | $5,300 | $27,800 |
| 2015 | $1,909 | $31,300 | $10,666 | $20,634 |
| 2014 | $1,909 | $28,400 | $10,666 | $17,734 |
Source: Public Records
Map
Nearby Homes
- 4190 Greenwood Ave
- 4198 Greenwood Ave
- 4172 Dallas Ave
- 4245 Holt Rd
- 4221 Watson Ave
- 4282 Woodworth Ave
- 4295 Bond Ave
- 3911 Marimba Ln
- 2216 Coolridge Rd
- 1858 Hall St
- 3860 Knotwood Dr
- 4314 Ringneck Ln
- 4461 Holt Rd
- 3795 Kirkland Ridge Dr
- 2189 N Aurelius Rd
- 4452 Cricket Ridge Dr Unit 202
- 0 Aurelius Rd Unit 282659
- 2520 Winterberry St
- 3829 E Willoughby Rd
- 4335 Norway St
- 2107 Delhi St NE
- 2101 Delhi St NE
- 2111 Delhi St NE
- 2093 Delhi St NE
- 2115 Delhi St NE
- 2108 Delhi St NE
- 2089 Delhi St NE
- 2104 Delhi St NE
- 2098 Delhi St NE
- 2119 Delhi St NE
- 2114 Delhi St NE
- 2092 Delhi St NE
- 2083 Delhi St NE
- 2120 Delhi St NE
- 2086 Delhi St NE
- 2101 Thorburn St
- 2082 Delhi St NE
- 2093 Thorburn St
- 2113 Thorburn St