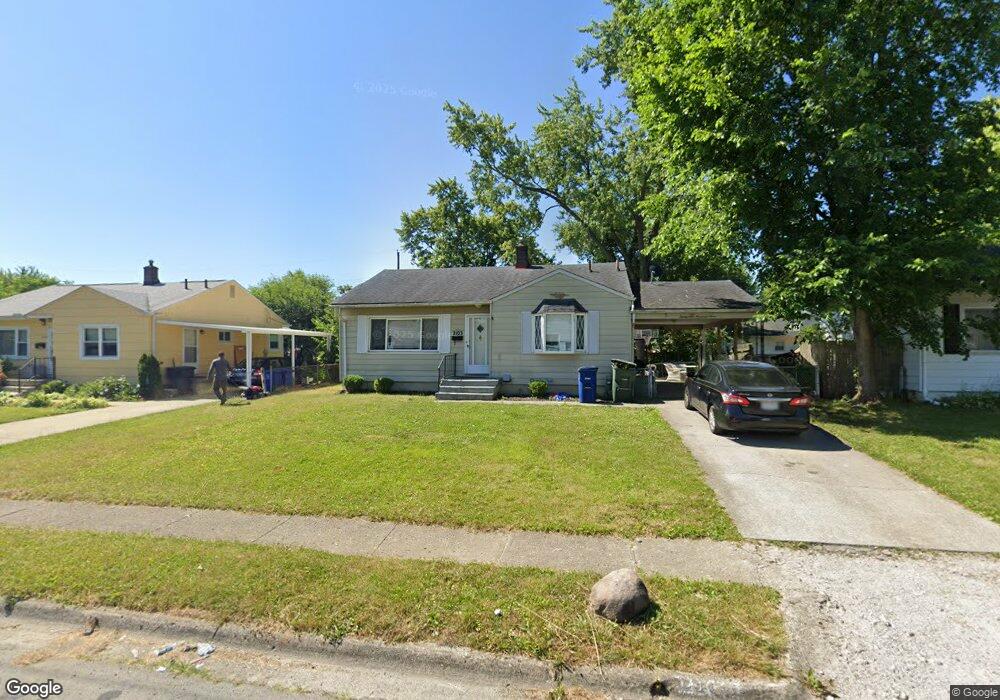
2103 Eden Ave Columbus, OH 43224
North Linden NeighborhoodEstimated Value: $181,636 - $232,000
3
Beds
2
Baths
1,142
Sq Ft
$178/Sq Ft
Est. Value
About This Home
This home is located at 2103 Eden Ave, Columbus, OH 43224 and is currently estimated at $202,909, approximately $177 per square foot. 2103 Eden Ave is a home located in Franklin County with nearby schools including North Linden Elementary School, Medina Middle School, and Mifflin High School.
Ownership History
Date
Name
Owned For
Owner Type
Purchase Details
Closed on
Oct 7, 2014
Sold by
Rivera Angel and Bayview Loan Servicing Llc
Bought by
First Union Capital Corp
Current Estimated Value
Purchase Details
Closed on
Nov 5, 2007
Sold by
Sre Holdings Llc
Bought by
Rivera Angel and Torres Gisela Vera
Home Financials for this Owner
Home Financials are based on the most recent Mortgage that was taken out on this home.
Original Mortgage
$89,000
Interest Rate
6.45%
Mortgage Type
Purchase Money Mortgage
Purchase Details
Closed on
Nov 13, 2006
Sold by
Jp Morgan Chase Bank Na
Bought by
Sre Holdings Llc
Purchase Details
Closed on
Aug 30, 2006
Sold by
Hardy Karen L and Case #05Cve10 11163
Bought by
Jp Morgan Chase Bank Na
Purchase Details
Closed on
Aug 24, 1995
Sold by
Piper Debra M
Bought by
Karen L Hardy
Home Financials for this Owner
Home Financials are based on the most recent Mortgage that was taken out on this home.
Original Mortgage
$69,500
Interest Rate
7.43%
Mortgage Type
New Conventional
Purchase Details
Closed on
Jun 1, 1993
Create a Home Valuation Report for This Property
The Home Valuation Report is an in-depth analysis detailing your home's value as well as a comparison with similar homes in the area
Home Values in the Area
Average Home Value in this Area
Purchase History
| Date | Buyer | Sale Price | Title Company |
|---|---|---|---|
| First Union Capital Corp | $44,000 | None Available | |
| Rivera Angel | $89,000 | Ohio Title | |
| Sre Holdings Llc | $52,000 | Resource T | |
| Jp Morgan Chase Bank Na | $68,000 | None Available | |
| Karen L Hardy | $72,000 | -- | |
| -- | $67,500 | -- |
Source: Public Records
Mortgage History
| Date | Status | Borrower | Loan Amount |
|---|---|---|---|
| Previous Owner | Rivera Angel | $89,000 | |
| Previous Owner | Karen L Hardy | $69,500 |
Source: Public Records
Tax History
| Year | Tax Paid | Tax Assessment Tax Assessment Total Assessment is a certain percentage of the fair market value that is determined by local assessors to be the total taxable value of land and additions on the property. | Land | Improvement |
|---|---|---|---|---|
| 2025 | $2,501 | $54,570 | $12,250 | $42,320 |
| 2024 | $2,501 | $54,570 | $12,250 | $42,320 |
| 2023 | $2,470 | $54,565 | $12,250 | $42,315 |
| 2022 | $1,553 | $29,230 | $5,500 | $23,730 |
| 2021 | $1,556 | $29,230 | $5,500 | $23,730 |
| 2020 | $1,558 | $29,230 | $5,500 | $23,730 |
| 2019 | $1,461 | $23,490 | $4,410 | $19,080 |
| 2018 | $1,405 | $23,490 | $4,410 | $19,080 |
| 2017 | $1,460 | $23,490 | $4,410 | $19,080 |
| 2016 | $1,484 | $21,850 | $4,100 | $17,750 |
| 2015 | $1,351 | $21,850 | $4,100 | $17,750 |
| 2014 | $1,355 | $21,850 | $4,100 | $17,750 |
| 2013 | $792 | $24,255 | $4,550 | $19,705 |
Source: Public Records
Map
Nearby Homes
- 2299 Belcher Dr
- 2298 Belcher Dr
- 2023 Ferris Rd
- 2196 Ferris Rd
- 1863 Ward Rd
- 2045 Sale Rd
- 2267 Ferris Rd
- 1936 Case Rd
- 2081 Ormond Ave
- 4123 Arbury Ln
- 2594 Adda Ave
- 4735 Heatherton Dr
- 2601 Brooklyn Rd
- 2583 Milverton Way
- 2010 Melrose Ave
- 2618 Clybourne Rd
- 0 Abington Rd Unit 225045775
- 0 Abington Rd Unit 224031704
- 0 Abington Rd Unit 224031738
- 0 Abington Rd Unit 224031699
Your Personal Tour Guide
Ask me questions while you tour the home.