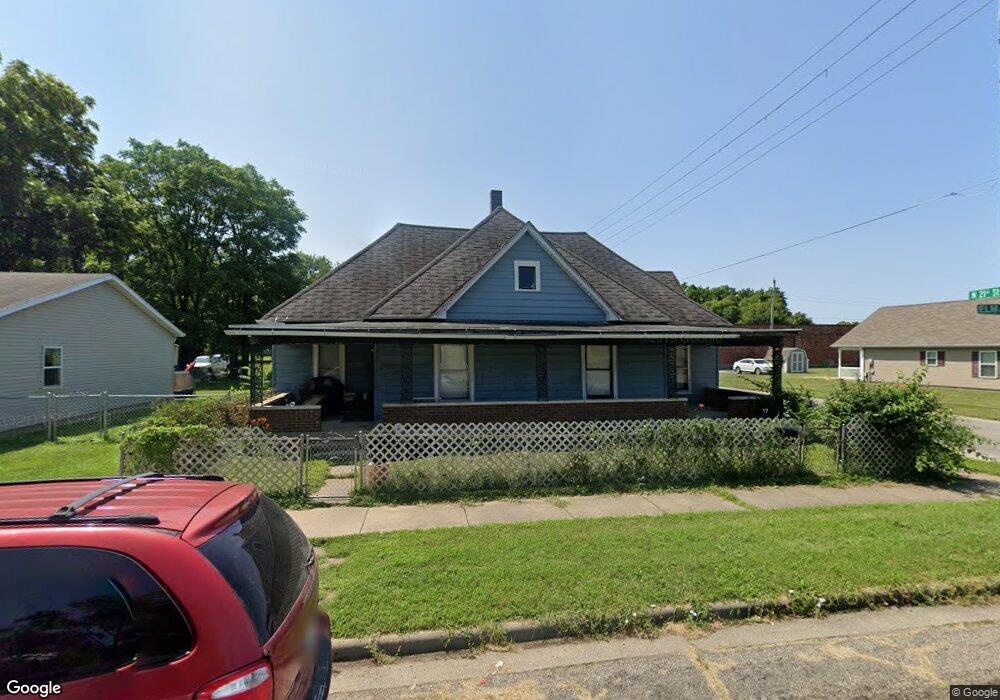
2103 Elm St Terre Haute, IN 47807
The Avenues NeighborhoodEstimated Value: $21,000 - $94,000
4
Beds
2
Baths
1,608
Sq Ft
$35/Sq Ft
Est. Value
About This Home
This home is located at 2103 Elm St, Terre Haute, IN 47807 and is currently estimated at $57,000, approximately $35 per square foot. 2103 Elm St is a home located in Vigo County with nearby schools including The Learning Lab, Woodrow Wilson Middle School, and Terre Haute North Vigo High School.
Ownership History
Date
Name
Owned For
Owner Type
Purchase Details
Closed on
May 21, 2020
Sold by
Windgate Properties Llc
Bought by
Safeguard Capital Partners Llc
Current Estimated Value
Purchase Details
Closed on
Dec 19, 2018
Sold by
Strong Virgil A
Bought by
Windgate Properties Llc
Purchase Details
Closed on
May 4, 2011
Sold by
Roberts Fannie B and Roberts Bruce
Bought by
Collins Jackie L
Create a Home Valuation Report for This Property
The Home Valuation Report is an in-depth analysis detailing your home's value as well as a comparison with similar homes in the area
Home Values in the Area
Average Home Value in this Area
Purchase History
| Date | Buyer | Sale Price | Title Company |
|---|---|---|---|
| Safeguard Capital Partners Llc | -- | None Available | |
| Windgate Properties Llc | $1,270 | None Available | |
| Collins Jackie L | -- | None Available |
Source: Public Records
Tax History Compared to Growth
Tax History
| Year | Tax Paid | Tax Assessment Tax Assessment Total Assessment is a certain percentage of the fair market value that is determined by local assessors to be the total taxable value of land and additions on the property. | Land | Improvement |
|---|---|---|---|---|
| 2024 | $466 | $5,600 | $5,600 | $0 |
| 2023 | $1,869 | $5,600 | $5,600 | $0 |
| 2022 | $1,235 | $57,100 | $8,000 | $49,100 |
| 2021 | $1,137 | $52,600 | $8,100 | $44,500 |
| 2020 | $1,127 | $52,100 | $8,000 | $44,100 |
| 2019 | $580 | $55,700 | $7,800 | $47,900 |
| 2018 | $806 | $53,700 | $7,500 | $46,200 |
| 2017 | $1,539 | $52,100 | $7,500 | $44,600 |
| 2016 | $521 | $52,100 | $7,500 | $44,600 |
| 2014 | $504 | $50,400 | $7,400 | $43,000 |
| 2013 | $504 | $49,500 | $7,200 | $42,300 |
Source: Public Records
Map
Nearby Homes