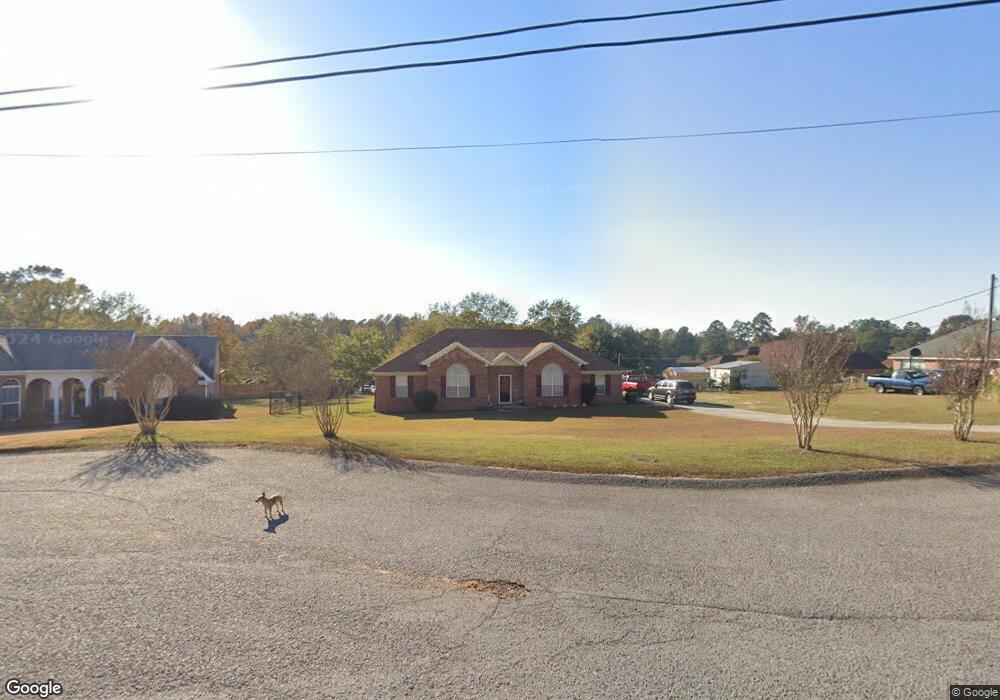
2103 Grouse Ct Hephzibah, GA 30815
Jamestown NeighborhoodEstimated Value: $273,000 - $320,000
4
Beds
3
Baths
2,324
Sq Ft
$132/Sq Ft
Est. Value
About This Home
This home is located at 2103 Grouse Ct, Hephzibah, GA 30815 and is currently estimated at $306,001, approximately $131 per square foot. 2103 Grouse Ct is a home located in Richmond County with nearby schools including Deer Chase Elementary School, Willis Foreman Elementary School, and Hephzibah Middle School.
Ownership History
Date
Name
Owned For
Owner Type
Purchase Details
Closed on
Nov 13, 1998
Sold by
Kenneth Smith Homebuilders Inc
Bought by
Kinder David A and Kinder Vivian M
Current Estimated Value
Home Financials for this Owner
Home Financials are based on the most recent Mortgage that was taken out on this home.
Original Mortgage
$139,944
Outstanding Balance
$29,506
Interest Rate
6.47%
Mortgage Type
VA
Estimated Equity
$276,495
Purchase Details
Closed on
Aug 3, 1998
Sold by
Central & Southern Bank Of Georgia
Bought by
Southern Specialty Development Co Inc
Home Financials for this Owner
Home Financials are based on the most recent Mortgage that was taken out on this home.
Original Mortgage
$102,900
Interest Rate
6.96%
Create a Home Valuation Report for This Property
The Home Valuation Report is an in-depth analysis detailing your home's value as well as a comparison with similar homes in the area
Home Values in the Area
Average Home Value in this Area
Purchase History
| Date | Buyer | Sale Price | Title Company |
|---|---|---|---|
| Kinder David A | $137,200 | -- | |
| Southern Specialty Development Co Inc | -- | -- | |
| Kenneth Smith Homebuilders Inc | $17,500 | -- |
Source: Public Records
Mortgage History
| Date | Status | Borrower | Loan Amount |
|---|---|---|---|
| Open | Kinder David A | $139,944 | |
| Previous Owner | Kenneth Smith Homebuilders Inc | $102,900 |
Source: Public Records
Tax History Compared to Growth
Tax History
| Year | Tax Paid | Tax Assessment Tax Assessment Total Assessment is a certain percentage of the fair market value that is determined by local assessors to be the total taxable value of land and additions on the property. | Land | Improvement |
|---|---|---|---|---|
| 2025 | $1,408 | $120,332 | $15,920 | $104,412 |
| 2024 | $1,408 | $118,724 | $15,920 | $102,804 |
| 2023 | $1,359 | $105,892 | $15,920 | $89,972 |
| 2022 | $1,152 | $78,034 | $15,920 | $62,114 |
| 2021 | $1,154 | $70,304 | $15,920 | $54,384 |
| 2020 | $1,162 | $70,304 | $15,920 | $54,384 |
| 2019 | $1,216 | $70,304 | $15,920 | $54,384 |
| 2018 | $1,222 | $70,304 | $15,920 | $54,384 |
| 2017 | $2,503 | $70,304 | $15,920 | $54,384 |
| 2016 | $2,505 | $70,304 | $15,920 | $54,384 |
| 2015 | $2,522 | $70,304 | $15,920 | $54,384 |
| 2014 | $2,510 | $69,846 | $15,920 | $53,926 |
Source: Public Records
Map
Nearby Homes
- 1914 Mitchell Place
- 2213 Riley Ct
- 1855 Beaver Creek Ln
- 4428 T J Kelly Dr
- 1610 Jonathan Place
- 2013 Bassford Dr
- 2613 Inverness Dr
- 1764 Deer Chase Ln
- 1708 Ethan Way
- 2525 Hollington Dr
- 2682 Inverness Dr
- 1012 Rosendale Dr
- 1016 Rosendale Dr
- 1018 Rosendale Dr
- 2686 Inverness Dr
- 2524 Hollington Dr
- 2505 Hollington Dr
- 2520 Hollington Dr
- 2690 Inverness Dr
- 2705 Inverness Dr
- 2105 Grouse Ct
- 2101 Grouse Ct
- 2004 Teal Ct
- 1938 Woodchuck Way
- 1936 Woodchuck Way
- 1934 Woodchuck Way
- 2107 Grouse Ct
- 2106 Grouse Ct
- 2002 Teal Ct
- 2102 Grouse Ct
- 2104 Grouse Ct
- 1932 Woodchuck Way
- 1930 Woodchuck Way
- 2005 Teal Ct
- 1922 Woodchuck Way
- 1920 Woodchuck Way
- 2003 Teal Ct
- 2007 Teal Ct
- 1924 Woodchuck Way
- 2010 Teal Ct