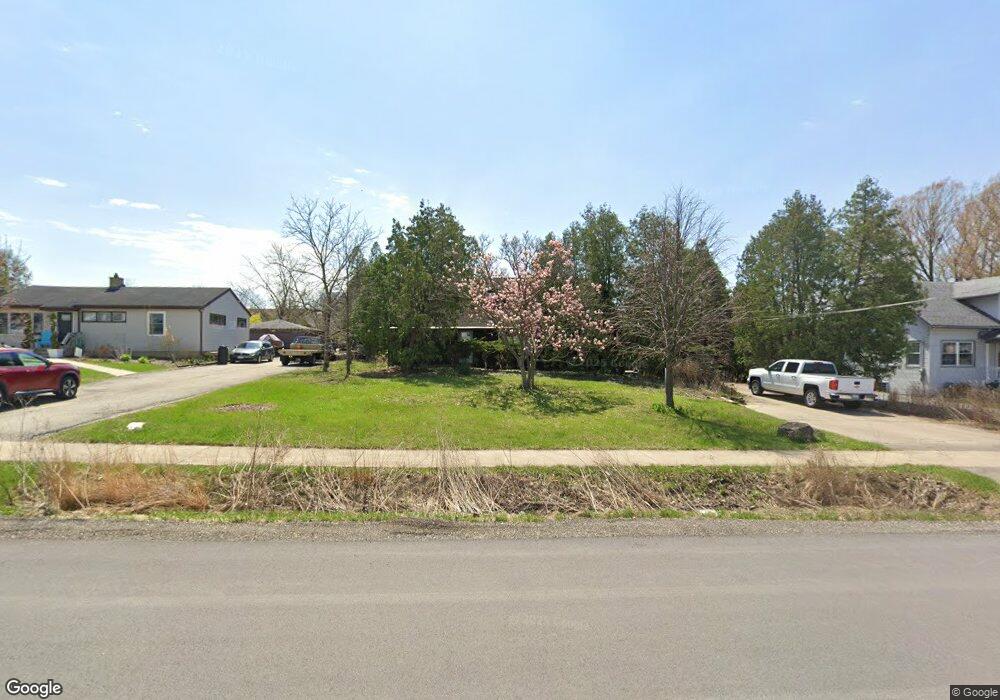
2103 Inverness Ave Downers Grove, IL 60515
Belmont NeighborhoodEstimated Value: $263,000 - $493,019
--
Bed
1
Bath
1,575
Sq Ft
$264/Sq Ft
Est. Value
About This Home
This home is located at 2103 Inverness Ave, Downers Grove, IL 60515 and is currently estimated at $415,755, approximately $263 per square foot. 2103 Inverness Ave is a home located in DuPage County with nearby schools including Henry Puffer School, Herrick Middle School, and Downer Grove North High School.
Ownership History
Date
Name
Owned For
Owner Type
Purchase Details
Closed on
Jul 29, 2016
Sold by
Graves Kathryn E and Kathryn E Graves Revocable Tru
Bought by
Graves Stephanie W and Lazar Peter P
Current Estimated Value
Purchase Details
Closed on
Jul 14, 2006
Sold by
Graves Steven E and Graves Kathryn E
Bought by
Graves Kathryn E and Kathryn E Graves Revocable Trust
Purchase Details
Closed on
Aug 26, 2002
Sold by
Dostal Milton L and Dostal Georgiana K
Bought by
Graves Steven E and Graves Kathryn E
Create a Home Valuation Report for This Property
The Home Valuation Report is an in-depth analysis detailing your home's value as well as a comparison with similar homes in the area
Home Values in the Area
Average Home Value in this Area
Purchase History
| Date | Buyer | Sale Price | Title Company |
|---|---|---|---|
| Graves Stephanie W | $180,000 | Attorney | |
| Graves Kathryn E | -- | None Available | |
| Graves Steven E | $229,000 | -- |
Source: Public Records
Tax History Compared to Growth
Tax History
| Year | Tax Paid | Tax Assessment Tax Assessment Total Assessment is a certain percentage of the fair market value that is determined by local assessors to be the total taxable value of land and additions on the property. | Land | Improvement |
|---|---|---|---|---|
| 2024 | -- | $146,199 | $50,424 | $95,775 |
| 2023 | $6,834 | $133,430 | $46,020 | $87,410 |
| 2022 | $6,494 | $126,290 | $43,830 | $82,460 |
| 2021 | $5,861 | $121,510 | $42,170 | $79,340 |
| 2020 | $5,765 | $119,320 | $41,410 | $77,910 |
| 2019 | $5,545 | $114,160 | $39,620 | $74,540 |
| 2018 | $5,268 | $106,850 | $37,080 | $69,770 |
| 2017 | $5,115 | $103,250 | $35,830 | $67,420 |
| 2016 | $4,792 | $99,510 | $34,530 | $64,980 |
| 2015 | $4,720 | $93,710 | $32,520 | $61,190 |
| 2014 | $4,954 | $90,320 | $31,340 | $58,980 |
| 2013 | $4,881 | $90,530 | $31,410 | $59,120 |
Source: Public Records
Map
Nearby Homes
- 5431 Ashbrook Place Unit 8
- 5434 Ashbrook Place
- 5509 Aspen Ave Unit 6
- 2160 Howard Ave
- 2335 Old George Way Unit 2335
- 5538 Durand Dr
- 5616 Durand Dr Unit 6D
- 5617 Durand Dr Unit 9A
- 5622 Belmont Rd
- 1903 Maple Ave
- 2605 Maple Ave
- 5727 Woodward Ave
- 5760 Woodward Ave
- 5454 Lee Ave
- 2749 College Rd
- 2800 Maple Ave Unit 31C
- 5540 Walnut Ave Unit 4A
- 5540 Walnut Ave Unit 15B
- 4947 Stonewall Ave
- 2900 Maple Ave Unit 13C
- 2101 Inverness Ave
- 2105 Inverness Ave
- 2099 Inverness Ave
- 2109 Inverness Ave
- 2254 Tamarack Dr
- 2250 Tamarack Dr
- 2258 Tamarack Dr
- 2246 Tamarack Dr
- 2236 Tamarack Dr
- 5419 Ashbrook Place Unit 2
- 5423 Ashbrook Place Unit 4
- 5421 Ashbrook Place
- 5417 Ashbrook Place Unit 1
- 5427 Ashbrook Place Unit 6
- 5429 Ashbrook Place Unit 7
- 5425 Ashbrook Place Unit 33
- 2234 Tamarack Dr
- 2242 Tamarack Dr
- 2226 Tamarack Dr
- 5439 Ashbrook Place