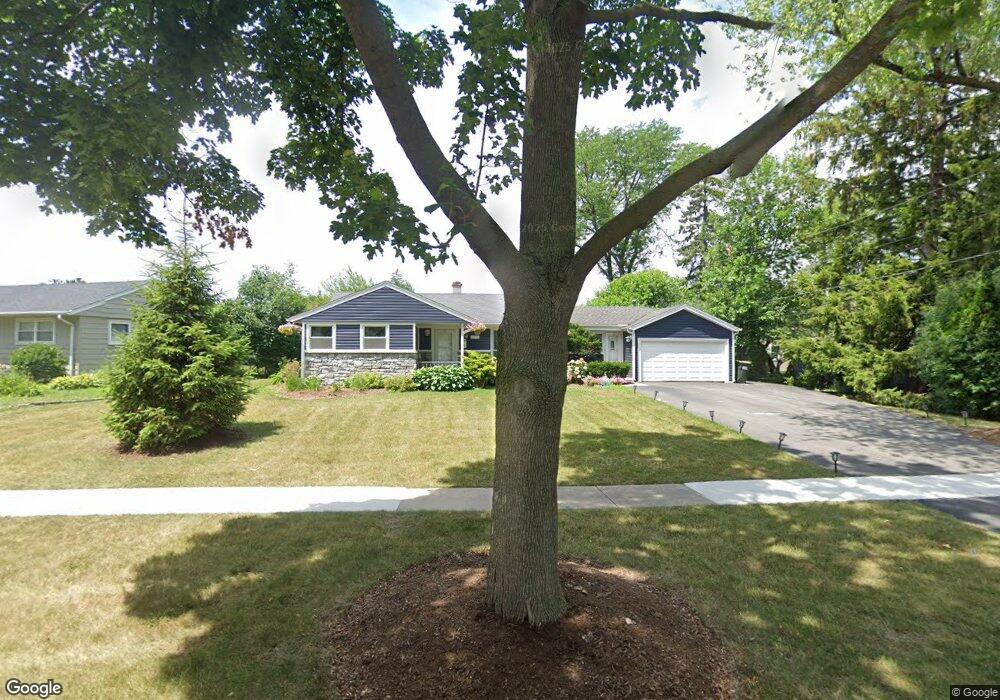
2103 Jay Ln Rolling Meadows, IL 60008
Estimated Value: $295,000 - $358,000
3
Beds
1
Bath
1,200
Sq Ft
$274/Sq Ft
Est. Value
About This Home
This home is located at 2103 Jay Ln, Rolling Meadows, IL 60008 and is currently estimated at $328,251, approximately $273 per square foot. 2103 Jay Ln is a home located in Cook County with nearby schools including Kimball Hill Elementary School, Carl Sandburg Junior High School, and Rolling Meadows High School.
Ownership History
Date
Name
Owned For
Owner Type
Purchase Details
Closed on
Jun 5, 2018
Sold by
Lockett Angela
Bought by
Vasquez Juan Luis
Current Estimated Value
Home Financials for this Owner
Home Financials are based on the most recent Mortgage that was taken out on this home.
Original Mortgage
$171,830
Interest Rate
4.5%
Mortgage Type
FHA
Purchase Details
Closed on
Nov 10, 1997
Sold by
Vandenekart Ad
Bought by
Lockett Angela
Home Financials for this Owner
Home Financials are based on the most recent Mortgage that was taken out on this home.
Original Mortgage
$39,865
Interest Rate
7.46%
Purchase Details
Closed on
Oct 15, 1993
Sold by
Downey Raymond J and Downey Lois Ann
Bought by
Lockett Angela M and Vandenekart Ad A
Home Financials for this Owner
Home Financials are based on the most recent Mortgage that was taken out on this home.
Original Mortgage
$121,076
Interest Rate
6.92%
Mortgage Type
FHA
Create a Home Valuation Report for This Property
The Home Valuation Report is an in-depth analysis detailing your home's value as well as a comparison with similar homes in the area
Home Values in the Area
Average Home Value in this Area
Purchase History
| Date | Buyer | Sale Price | Title Company |
|---|---|---|---|
| Vasquez Juan Luis | $175,000 | Chicago Title | |
| Lockett Angela | -- | -- | |
| Lockett Angela M | $81,333 | -- |
Source: Public Records
Mortgage History
| Date | Status | Borrower | Loan Amount |
|---|---|---|---|
| Previous Owner | Vasquez Juan Luis | $171,830 | |
| Previous Owner | Lockett Angela | $39,865 | |
| Previous Owner | Lockett Angela M | $121,076 |
Source: Public Records
Tax History
| Year | Tax Paid | Tax Assessment Tax Assessment Total Assessment is a certain percentage of the fair market value that is determined by local assessors to be the total taxable value of land and additions on the property. | Land | Improvement |
|---|---|---|---|---|
| 2025 | $7,355 | $27,000 | $6,281 | $20,719 |
| 2024 | $7,355 | $24,000 | $5,315 | $18,685 |
| 2023 | $7,044 | $24,000 | $5,315 | $18,685 |
| 2022 | $7,044 | $24,000 | $5,315 | $18,685 |
| 2021 | $5,791 | $17,486 | $3,140 | $14,346 |
| 2020 | $5,654 | $17,486 | $3,140 | $14,346 |
| 2019 | $5,684 | $19,538 | $3,140 | $16,398 |
| 2018 | $6,377 | $19,689 | $2,898 | $16,791 |
| 2017 | $6,247 | $19,689 | $2,898 | $16,791 |
| 2016 | $5,820 | $19,689 | $2,898 | $16,791 |
| 2015 | $4,503 | $16,924 | $2,657 | $14,267 |
| 2014 | $4,412 | $16,924 | $2,657 | $14,267 |
| 2013 | $4,288 | $16,924 | $2,657 | $14,267 |
Source: Public Records
Map
Nearby Homes
- 2705 Park St
- 3100 Town Square Dr Unit 308
- 3100 Town Square Dr Unit 204
- 2401 Rohlwing Rd
- 912 N Chicago Ave
- 3306 Trillium Cir Unit 3001
- 1506 W Northwest Hwy
- 3209 Trillium Cir
- 2709 Lily Ln
- 3135 Town Square Dr Unit 401
- 3265 Kirchoff Rd Unit 116
- 3345 Kirchoff Rd Unit 5C
- 2201 Kingfisher Ln
- 628 S Wilke Rd
- 1215 W Sigwalt St Unit A
- 408 N Kennicott Ave
- 3200 Thrush Ln
- 3605 Oriole Ln
- 2600 Brookwood Way Dr Unit 316
- 2600 Brookwood Way Dr Unit 305
- 2105 Jay Ln
- 2101 Jay Ln
- 2603 Fremont St
- 2605 Fremont St
- 2600 Saint James St Unit 3
- 2602 Saint James St
- 2701 Fremont St
- 2100 Jay Ln
- 2102 Jay Ln
- 2700 Saint James St
- 2104 Jay Ln
- 2106 Jay Ln
- 2703 Fremont St
- 2200 Jay Ln
- 2505 Fremont St
- 2702 Saint James St
- 2202 Jay Ln
- 2602 Fremont St Unit 3
- 2602 Fremont St
- 2600 Fremont St
Your Personal Tour Guide
Ask me questions while you tour the home.