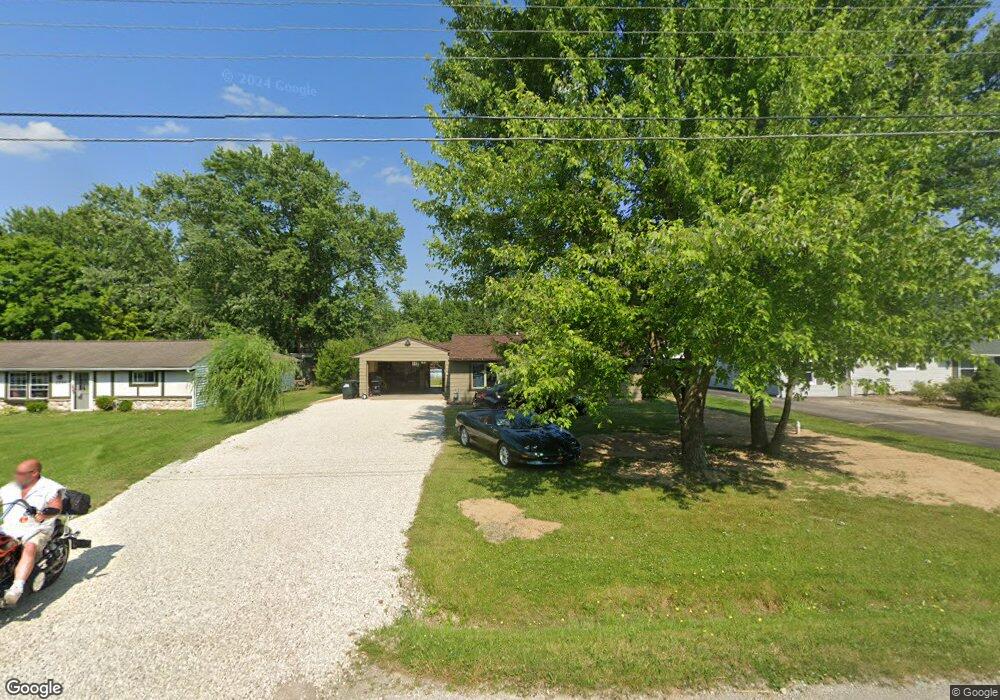
2103 Josephine Blvd Brunswick, OH 44212
Estimated Value: $212,819 - $221,000
3
Beds
1
Bath
1,098
Sq Ft
$196/Sq Ft
Est. Value
About This Home
This home is located at 2103 Josephine Blvd, Brunswick, OH 44212 and is currently estimated at $215,205, approximately $195 per square foot. 2103 Josephine Blvd is a home located in Medina County with nearby schools including Applewood Elementary School, Willets Middle School, and Brunswick High School.
Ownership History
Date
Name
Owned For
Owner Type
Purchase Details
Closed on
Aug 22, 2006
Sold by
Fletcher Mike T
Bought by
Fletcher Mike T
Current Estimated Value
Home Financials for this Owner
Home Financials are based on the most recent Mortgage that was taken out on this home.
Original Mortgage
$111,000
Outstanding Balance
$32,957
Interest Rate
6.88%
Mortgage Type
Future Advance Clause Open End Mortgage
Estimated Equity
$182,248
Purchase Details
Closed on
Dec 2, 1998
Sold by
Massey Ginger D and Massey William R
Bought by
Fletcher Mike T
Home Financials for this Owner
Home Financials are based on the most recent Mortgage that was taken out on this home.
Original Mortgage
$90,746
Interest Rate
6.8%
Mortgage Type
FHA
Purchase Details
Closed on
Sep 3, 1997
Sold by
Massey Ginger D
Bought by
Massey William R and Massey Ginger D
Home Financials for this Owner
Home Financials are based on the most recent Mortgage that was taken out on this home.
Original Mortgage
$74,800
Interest Rate
7.09%
Create a Home Valuation Report for This Property
The Home Valuation Report is an in-depth analysis detailing your home's value as well as a comparison with similar homes in the area
Home Values in the Area
Average Home Value in this Area
Purchase History
| Date | Buyer | Sale Price | Title Company |
|---|---|---|---|
| Fletcher Mike T | -- | -- | |
| Fletcher Mike T | $91,000 | Executive Title Agency Corp | |
| Massey William R | -- | Guardian Title |
Source: Public Records
Mortgage History
| Date | Status | Borrower | Loan Amount |
|---|---|---|---|
| Open | Fletcher Mike T | $111,000 | |
| Previous Owner | Fletcher Mike T | $90,746 | |
| Previous Owner | Massey William R | $74,800 |
Source: Public Records
Tax History Compared to Growth
Tax History
| Year | Tax Paid | Tax Assessment Tax Assessment Total Assessment is a certain percentage of the fair market value that is determined by local assessors to be the total taxable value of land and additions on the property. | Land | Improvement |
|---|---|---|---|---|
| 2024 | $2,438 | $49,280 | $23,810 | $25,470 |
| 2023 | $2,438 | $49,280 | $23,810 | $25,470 |
| 2022 | $3,488 | $49,280 | $23,810 | $25,470 |
| 2021 | $3,134 | $39,110 | $18,900 | $20,210 |
| 2020 | $2,834 | $39,110 | $18,900 | $20,210 |
| 2019 | $3,029 | $39,110 | $18,900 | $20,210 |
| 2018 | $2,627 | $30,150 | $16,400 | $13,750 |
| 2017 | $2,518 | $30,150 | $16,400 | $13,750 |
| 2016 | $2,268 | $30,150 | $16,400 | $13,750 |
| 2015 | $2,222 | $27,910 | $15,180 | $12,730 |
| 2014 | $2,219 | $27,910 | $15,180 | $12,730 |
| 2013 | $2,186 | $27,910 | $15,180 | $12,730 |
Source: Public Records
Map
Nearby Homes
- 4027 Sleepy Hollow Rd
- 2105 Glenmont
- LUCAS TH Plan at Market Highlands
- LIBBY TH Plan at Market Highlands
- ABBY TH Plan at Market Highlands
- 2097 Glenmont
- 2091 Glenmont
- 2090 Glenmont
- 2088 Glenmont
- 4231 Shalbey Trail
- 4075 Sterling Station Dr
- 1960 George Dr
- 3818 Sleepy Hollow Rd
- 1821 Stone Manor Cir
- 1818 Hobbits Way
- 4374 Lochs Ln
- 4137 Foskett Rd
- 1727 Brintnall Dr
- 4464 Newcastle Cove
- 1851 Manningford Oval
- 2111 Josephine Blvd
- 2095 Josephine Blvd
- 2117 Josephine Blvd
- 2100 Josephine Blvd
- 2081 Josephine Blvd
- 2089 Josephine Blvd
- 2092 Josephine Blvd
- 2116 Josephine Blvd
- 2108 Josephine Blvd
- 2125 Josephine Blvd
- 2104 Etta Blvd
- 2096 Etta Blvd
- 2133 Josephine Blvd
- 2118 Etta Blvd
- 2126 Josephine Blvd
- 2126 Josephine Blvd
- 2112 Etta Blvd
- 2134 Etta Blvd
- 2084 Josephine Blvd
- 2065 Josephine Blvd