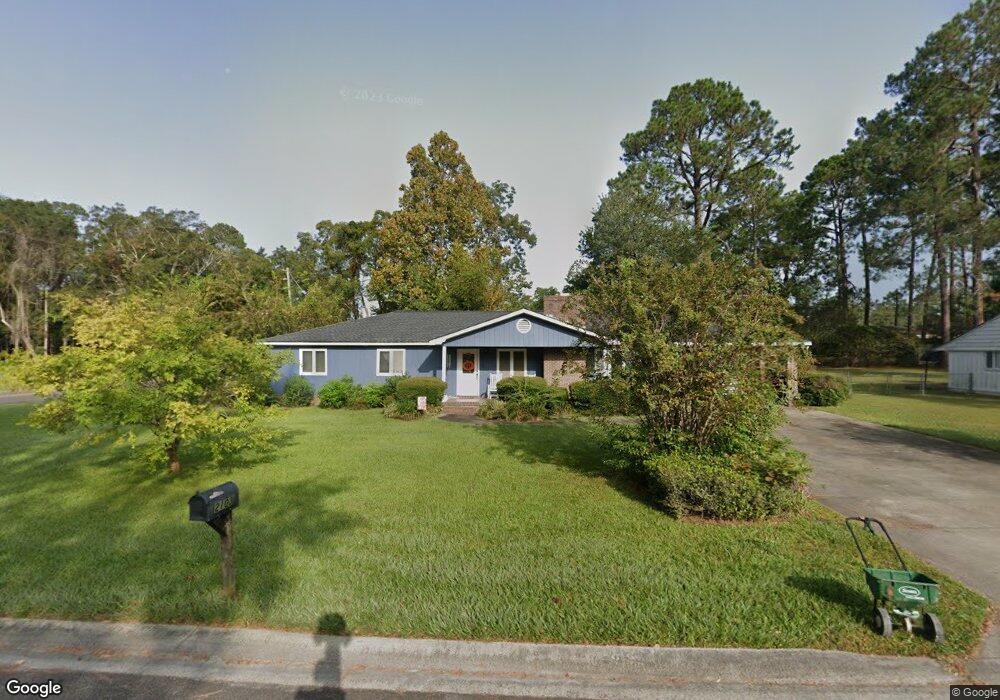
2103 Lakeview Dr Waycross, GA 31501
Estimated Value: $188,000 - $198,756
3
Beds
2
Baths
1,882
Sq Ft
$103/Sq Ft
Est. Value
About This Home
This home is located at 2103 Lakeview Dr, Waycross, GA 31501 and is currently estimated at $194,439, approximately $103 per square foot. 2103 Lakeview Dr is a home located in Ware County with nearby schools including Center Elementary School, Waycross Middle School, and Ware County High School.
Ownership History
Date
Name
Owned For
Owner Type
Purchase Details
Closed on
Oct 7, 2011
Sold by
Fnb South
Bought by
Obara Kenneth W
Current Estimated Value
Purchase Details
Closed on
May 3, 2011
Sold by
Hudson James R and Hudson Rita A
Bought by
Fnb South
Purchase Details
Closed on
Nov 23, 1992
Bought by
Mosley Bonnie F
Purchase Details
Closed on
Jul 17, 1985
Create a Home Valuation Report for This Property
The Home Valuation Report is an in-depth analysis detailing your home's value as well as a comparison with similar homes in the area
Home Values in the Area
Average Home Value in this Area
Purchase History
| Date | Buyer | Sale Price | Title Company |
|---|---|---|---|
| Obara Kenneth W | $66,500 | -- | |
| Fnb South | $66,500 | -- | |
| Mosley Bonnie F | -- | -- | |
| -- | $57,500 | -- |
Source: Public Records
Tax History Compared to Growth
Tax History
| Year | Tax Paid | Tax Assessment Tax Assessment Total Assessment is a certain percentage of the fair market value that is determined by local assessors to be the total taxable value of land and additions on the property. | Land | Improvement |
|---|---|---|---|---|
| 2024 | $3,008 | $75,316 | $4,320 | $70,996 |
| 2023 | $2,597 | $59,018 | $4,330 | $54,688 |
| 2022 | $2,336 | $58,615 | $4,330 | $54,285 |
| 2021 | $2,031 | $46,980 | $4,330 | $42,650 |
| 2020 | $2,048 | $46,980 | $4,330 | $42,650 |
| 2019 | $1,578 | $35,690 | $4,330 | $31,360 |
| 2018 | $1,537 | $34,436 | $4,330 | $30,106 |
| 2017 | $1,501 | $34,436 | $4,330 | $30,106 |
| 2016 | $1,501 | $34,436 | $4,330 | $30,106 |
| 2015 | $1,512 | $34,435 | $4,330 | $30,106 |
| 2014 | $1,510 | $34,435 | $4,330 | $30,106 |
| 2013 | -- | $34,435 | $4,329 | $30,105 |
Source: Public Records
Map
Nearby Homes
- 2108 Screven Ave
- 1103 Kontz Ave
- 1715 City Blvd
- 1011 Cherokee Cir
- 1002 Cherokee Cir
- Lot 3 City Blvd
- 1206 Morningside Dr
- 1703 Rainbow Dr
- 1621 Camellia Dr
- 706 Cherokee Cir
- 2706 Alice St
- 00 Seminole Trail
- 1400 E Cherokee Dr
- 1001 Coral Rd
- 1701 Satilla Blvd
- 1500 Saint Marys Dr
- 2202 Pioneer St
- 00 Pineview Dr
- 0 Pineview Dr
- 1009 Euclid Ave
- 2105 Lakeview Dr
- 1820 City Blvd
- 2107 Lakeview Dr
- 2106 Screven Ave
- 1901 City Blvd
- 2106 Lakeview Dr
- 2109 Lakeview Dr
- 2108 Lakeview Dr
- 2110 Screven Ave
- 1007 Dogwood Dr
- 2112 Lakeview Dr
- 2114 Screven Ave
- 2117 Lakeview Dr
- 1804 City Blvd
- 1003 Dogwood Dr
- 1718 Dean Dr
- 1001 Dogwood Dr
- 2116 Screven Ave
- 2116 Lakeview Dr
- 2119 Lakeview Dr