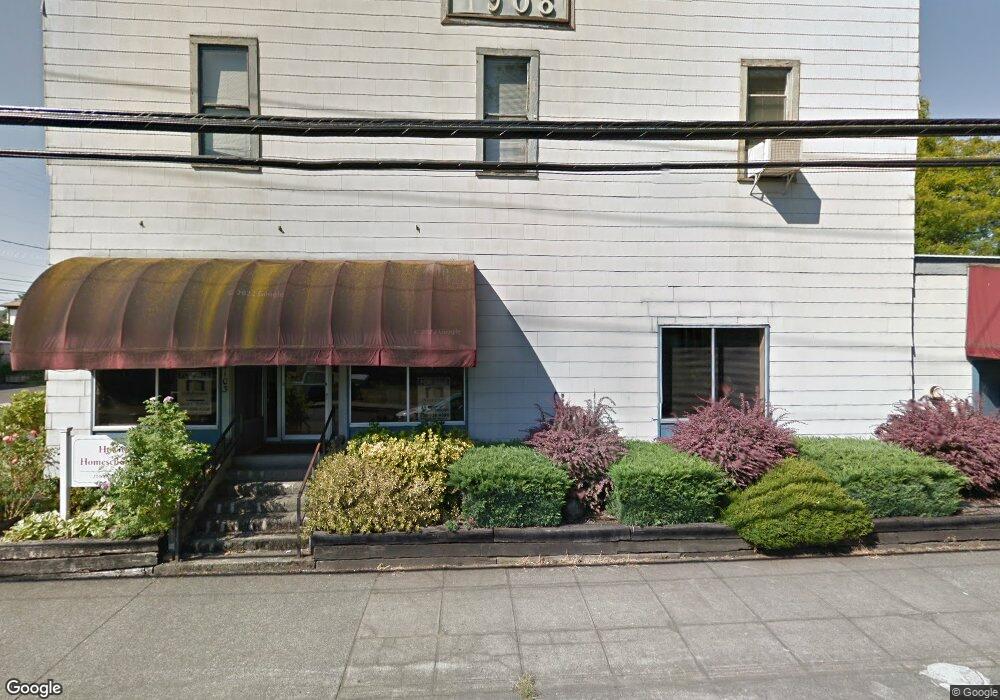
2103 Main St Washougal, WA 98671
Downtown Washougal NeighborhoodEstimated Value: $897,523
--
Bed
--
Bath
7,851
Sq Ft
$114/Sq Ft
Est. Value
About This Home
This home is located at 2103 Main St, Washougal, WA 98671 and is currently estimated at $897,523, approximately $114 per square foot. 2103 Main St is a home located in Clark County with nearby schools including Gause Elementary School, Jemtegaard Middle School, and Washougal High School.
Ownership History
Date
Name
Owned For
Owner Type
Purchase Details
Closed on
Sep 1, 2023
Sold by
Marrow Properties Llc
Bought by
Exterior Home Improvement Llc
Current Estimated Value
Home Financials for this Owner
Home Financials are based on the most recent Mortgage that was taken out on this home.
Original Mortgage
$360,000
Outstanding Balance
$230,469
Interest Rate
6.81%
Mortgage Type
Seller Take Back
Estimated Equity
$667,054
Purchase Details
Closed on
May 28, 2015
Sold by
Hewitt Research Foundation Inc
Bought by
Marrow Properties Llc
Home Financials for this Owner
Home Financials are based on the most recent Mortgage that was taken out on this home.
Original Mortgage
$181,000
Interest Rate
3.64%
Mortgage Type
Seller Take Back
Create a Home Valuation Report for This Property
The Home Valuation Report is an in-depth analysis detailing your home's value as well as a comparison with similar homes in the area
Home Values in the Area
Average Home Value in this Area
Purchase History
| Date | Buyer | Sale Price | Title Company |
|---|---|---|---|
| Exterior Home Improvement Llc | -- | Fidelity National Title | |
| Marrow Properties Llc | $271,000 | Fidelity Title |
Source: Public Records
Mortgage History
| Date | Status | Borrower | Loan Amount |
|---|---|---|---|
| Open | Exterior Home Improvement Llc | $360,000 | |
| Previous Owner | Marrow Properties Llc | $181,000 |
Source: Public Records
Tax History Compared to Growth
Tax History
| Year | Tax Paid | Tax Assessment Tax Assessment Total Assessment is a certain percentage of the fair market value that is determined by local assessors to be the total taxable value of land and additions on the property. | Land | Improvement |
|---|---|---|---|---|
| 2025 | $3,429 | $361,200 | $120,000 | $241,200 |
| 2024 | $3,279 | $361,200 | $151,800 | $209,400 |
| 2023 | $2,911 | $314,100 | $132,000 | $182,100 |
| 2022 | $3,048 | $314,100 | $132,000 | $182,100 |
| 2021 | $3,104 | $285,500 | $120,000 | $165,500 |
| 2020 | $3,055 | $272,895 | $105,000 | $167,895 |
| 2019 | $2,752 | $272,895 | $105,000 | $167,895 |
| 2018 | $3,334 | $259,900 | $0 | $0 |
| 2017 | $3,998 | $259,900 | $0 | $0 |
| 2016 | $4,372 | $342,500 | $0 | $0 |
| 2015 | -- | $342,500 | $0 | $0 |
| 2014 | -- | $0 | $0 | $0 |
| 2013 | -- | $0 | $0 | $0 |
Source: Public Records
Map
Nearby Homes