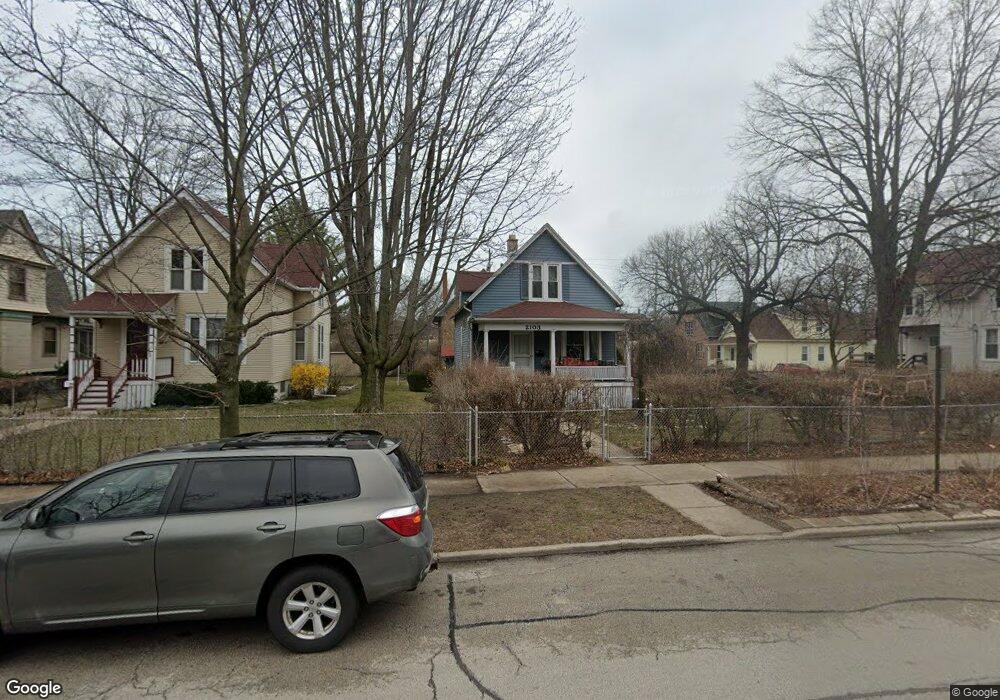
2103 Maple Ave Evanston, IL 60201
Northeast Evanston NeighborhoodEstimated Value: $837,004 - $929,000
4
Beds
2
Baths
1,838
Sq Ft
$475/Sq Ft
Est. Value
About This Home
This home is located at 2103 Maple Ave, Evanston, IL 60201 and is currently estimated at $872,501, approximately $474 per square foot. 2103 Maple Ave is a home located in Cook County with nearby schools including Dewey Elementary School, Washington Elementary School, and Nichols Middle School.
Ownership History
Date
Name
Owned For
Owner Type
Purchase Details
Closed on
Oct 24, 2024
Sold by
Nieves Emily Joy Ekstrand
Bought by
Emily J Ekstrand Nieves Trust and Nieves
Current Estimated Value
Purchase Details
Closed on
Dec 17, 2009
Sold by
Ekstrand June E and Ekstrand Bruce
Bought by
Nieves Emily Joy Ekstrand and Nieves Alfonso
Home Financials for this Owner
Home Financials are based on the most recent Mortgage that was taken out on this home.
Original Mortgage
$300,000
Interest Rate
4.78%
Mortgage Type
New Conventional
Purchase Details
Closed on
Aug 5, 2002
Sold by
Ekstrand June E
Bought by
Ekstrand June E and Ekstrand Bruce
Purchase Details
Closed on
Jan 28, 1996
Sold by
Ekstrand June E
Bought by
Ekstrand June E and June E Ekstrand Trust #1
Create a Home Valuation Report for This Property
The Home Valuation Report is an in-depth analysis detailing your home's value as well as a comparison with similar homes in the area
Home Values in the Area
Average Home Value in this Area
Purchase History
| Date | Buyer | Sale Price | Title Company |
|---|---|---|---|
| Emily J Ekstrand Nieves Trust | -- | None Listed On Document | |
| Nieves Emily Joy Ekstrand | $400,000 | Chicago Title Insurance Co | |
| Ekstrand June E | -- | -- | |
| Ekstrand June E | -- | -- |
Source: Public Records
Mortgage History
| Date | Status | Borrower | Loan Amount |
|---|---|---|---|
| Previous Owner | Nieves Emily Joy Ekstrand | $300,000 |
Source: Public Records
Tax History
| Year | Tax Paid | Tax Assessment Tax Assessment Total Assessment is a certain percentage of the fair market value that is determined by local assessors to be the total taxable value of land and additions on the property. | Land | Improvement |
|---|---|---|---|---|
| 2025 | $12,782 | $70,001 | $15,488 | $54,513 |
| 2024 | $12,782 | $56,116 | $13,125 | $42,991 |
| 2023 | $12,241 | $56,116 | $13,125 | $42,991 |
| 2022 | $12,241 | $56,116 | $13,125 | $42,991 |
| 2021 | $11,636 | $47,176 | $8,662 | $38,514 |
| 2020 | $11,540 | $47,176 | $8,662 | $38,514 |
| 2019 | $11,290 | $51,615 | $8,662 | $42,953 |
| 2018 | $13,683 | $53,378 | $7,350 | $46,028 |
| 2017 | $13,342 | $53,378 | $7,350 | $46,028 |
| 2016 | $12,877 | $53,378 | $7,350 | $46,028 |
| 2015 | $10,516 | $41,841 | $6,300 | $35,541 |
| 2014 | $10,430 | $41,841 | $6,300 | $35,541 |
| 2013 | $10,174 | $41,841 | $6,300 | $35,541 |
Source: Public Records
Map
Nearby Homes
- 2016 Sherman Ave Unit 1E
- 2236 Ridge Ave
- 2033 Sherman Ave Unit 504
- 2033 Sherman Ave Unit 409
- 730 Noyes St Unit K3
- 2248 Sherman Ave Unit 3
- 2001 Sherman Ave Unit 203
- 724 Noyes St Unit F1
- 1201 Noyes St
- 2043 Asbury Ave
- 1929 Sherman Ave Unit 2W
- 2316 Sherman Ave Unit 1B
- 1864 Sherman Ave Unit 5NW
- 2215 Wesley Ave
- 1860 Sherman Ave Unit 5NW
- 1860 Sherman Ave Unit 7NE
- 2016.5 Sherman Ave Unit 1S
- 1228 Emerson St Unit 304
- 726 Lincoln St
- 1834 Ridge Ave Unit 102
- 2107 Maple Ave
- 911 Simpson St
- 918 Simpson St
- 2111 Maple Ave
- 2113 Maple Ave
- 912 Simpson St
- 2115 Maple Ave
- 910 Simpson St
- 2102 Maple Ave
- 2106 Maple Ave
- 917 Hamlin St Unit B
- 2039 Maple Ave
- 915 Hamlin St Unit A
- 2110 Maple Ave
- 2110 Maple Ave Unit 2
- 2110 Maple Ave Unit 1
- 913 Hamlin St
- 2114 Maple Ave
- 909 Hamlin St
- 909 Hamlin St Unit 1
Your Personal Tour Guide
Ask me questions while you tour the home.