Estimated Value: $190,919 - $229,000
3
Beds
2
Baths
1,629
Sq Ft
$125/Sq Ft
Est. Value
About This Home
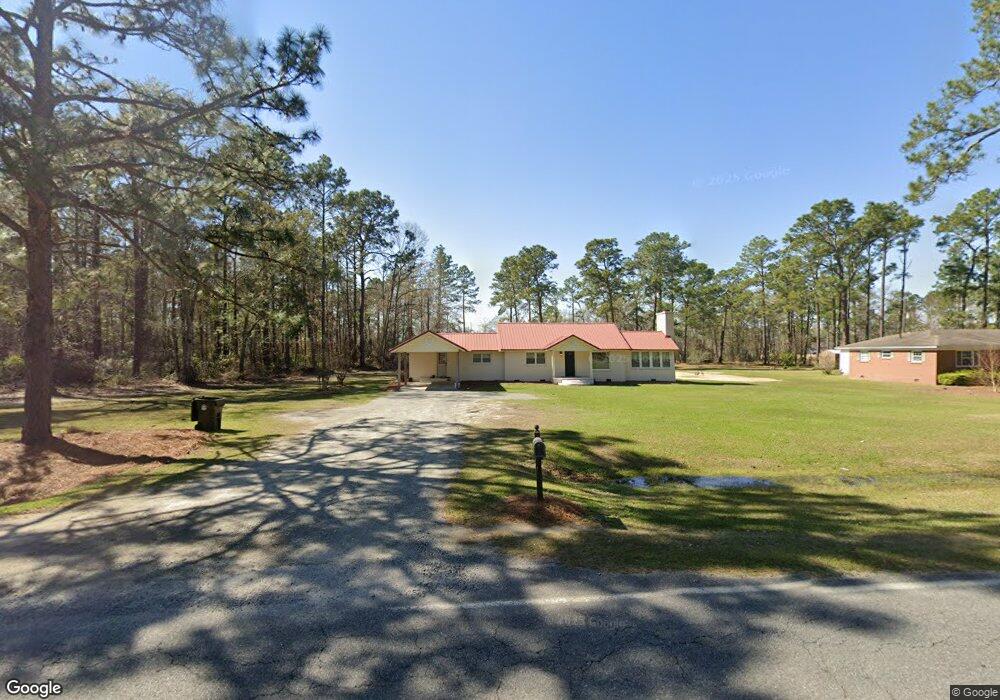
This home is located at 2103 Massee Post Rd, Adel, GA 31620 and is currently estimated at $203,730, approximately $125 per square foot. 2103 Massee Post Rd is a home located in Cook County with nearby schools including Cook Primary School, Cook Elementary School, and Cook County Middle School.
Ownership History
Date
Name
Owned For
Owner Type
Purchase Details
Closed on
Apr 30, 2014
Sold by
Federal National Mortgage Association
Bought by
Whitaker Morgan Kayla
Current Estimated Value
Home Financials for this Owner
Home Financials are based on the most recent Mortgage that was taken out on this home.
Original Mortgage
$69,387
Outstanding Balance
$52,329
Interest Rate
4.44%
Mortgage Type
New Conventional
Estimated Equity
$151,401
Purchase Details
Closed on
Nov 13, 2013
Sold by
York Marion E
Bought by
Federal National Mtg Associati
Purchase Details
Closed on
May 25, 2007
Sold by
Haile Joseph F
Bought by
York Marion E and York Nikki
Home Financials for this Owner
Home Financials are based on the most recent Mortgage that was taken out on this home.
Original Mortgage
$124,000
Interest Rate
6.17%
Mortgage Type
New Conventional
Purchase Details
Closed on
Aug 18, 2006
Sold by
Tillman Cynthia Connell
Bought by
Haile Joseph F and Haile Dianne
Create a Home Valuation Report for This Property
The Home Valuation Report is an in-depth analysis detailing your home's value as well as a comparison with similar homes in the area
Home Values in the Area
Average Home Value in this Area
Purchase History
| Date | Buyer | Sale Price | Title Company |
|---|---|---|---|
| Whitaker Morgan Kayla | $68,000 | -- | |
| Federal National Mtg Associati | $114,175 | -- | |
| York Marion E | $155,000 | -- | |
| Haile Joseph F | $56,457 | -- |
Source: Public Records
Mortgage History
| Date | Status | Borrower | Loan Amount |
|---|---|---|---|
| Open | Whitaker Morgan Kayla | $69,387 | |
| Previous Owner | York Marion E | $124,000 |
Source: Public Records
Tax History
| Year | Tax Paid | Tax Assessment Tax Assessment Total Assessment is a certain percentage of the fair market value that is determined by local assessors to be the total taxable value of land and additions on the property. | Land | Improvement |
|---|---|---|---|---|
| 2025 | $1,461 | $61,524 | $6,956 | $54,568 |
| 2024 | $1,558 | $48,943 | $5,499 | $43,444 |
| 2023 | $1,359 | $42,882 | $4,910 | $37,972 |
| 2022 | $968 | $31,012 | $4,910 | $26,102 |
| 2021 | $875 | $26,402 | $4,910 | $21,492 |
| 2020 | $875 | $26,402 | $4,910 | $21,492 |
| 2019 | $876 | $26,402 | $4,910 | $21,492 |
| 2018 | $932 | $26,402 | $4,910 | $21,492 |
| 2017 | $877 | $26,402 | $4,910 | $21,492 |
| 2016 | $878 | $26,402 | $4,910 | $21,492 |
| 2015 | $772 | $41,790 | $5,456 | $36,334 |
| 2014 | $1,426 | $41,790 | $5,456 | $36,334 |
| 2013 | -- | $41,790 | $5,455 | $36,334 |
Source: Public Records
Map
Nearby Homes
- 2304 Thomas St
- 2302 Thomas St
- 2601 Massee Post Rd
- 2603 Dianne St
- 1715 Jimmy St
- 1704 Jimmy St
- 1607 Jimmy St
- 2698 Woodland Dr
- 526 E Mitchell St
- 625 Coxstill Rd
- 701 Gloria St
- 309 Wayne St
- 284 Barrett Rd
- 315 Newton Dr
- 814 N Cleveland Ave
- 708 Town And Country Dr
- 609 E 4th St
- 322 Magnolia Dr
- 211 S Gordon Ave
- 317 Brookside Dr
- 2201 Massee Post Rd
- 2200 Massee Post Rd
- 2301 Massee Post Rd
- 2300 Massee Post Rd
- 2301 Massee Post Rd
- 2301 Bear Creek Rd
- 2055 Moore St
- 2313 Bear Creek Rd
- 2315 Bear Creek Rd
- 2310 Thomas St
- 2400 Massee Post Rd
- 2317 Bear Creek Rd
- 1600 Massee Post Rd
- 2314 Thomas St
- 2503 Dottie St
- . Dottie St
- 2401 Bear Creek Rd
- 2505 Dottie St
- 2308 Thomas St
- 2309 Thomas St
Your Personal Tour Guide
Ask me questions while you tour the home.