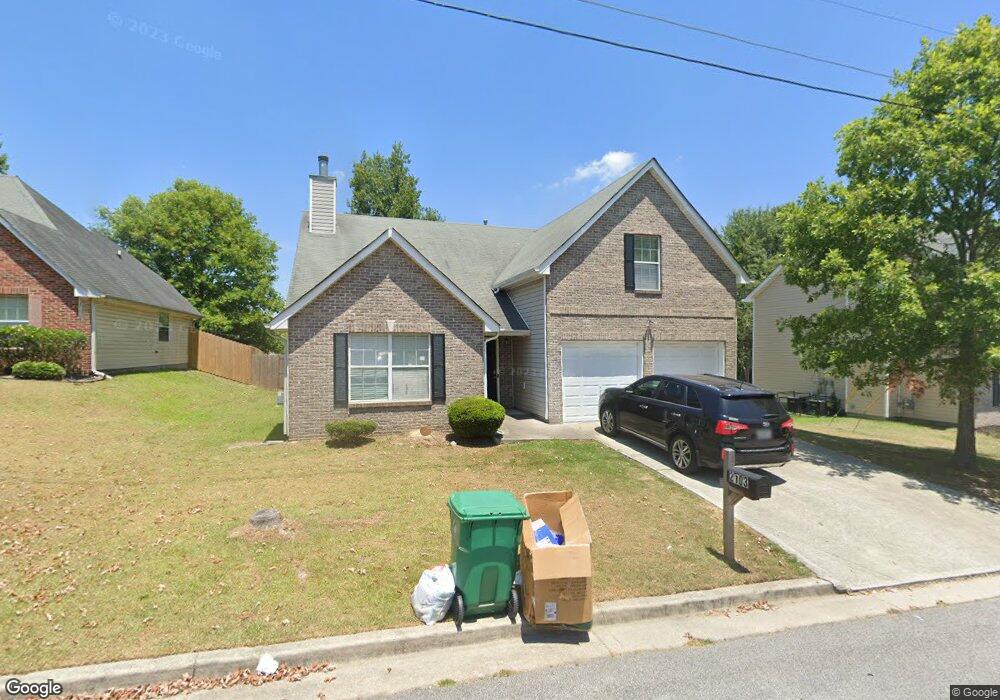
2103 Mulberry Ln Unit 353 Lithonia, GA 30058
Estimated Value: $263,034 - $286,000
4
Beds
3
Baths
1,652
Sq Ft
$167/Sq Ft
Est. Value
About This Home
This home is located at 2103 Mulberry Ln Unit 353, Lithonia, GA 30058 and is currently estimated at $275,759, approximately $166 per square foot. 2103 Mulberry Ln Unit 353 is a home located in DeKalb County with nearby schools including Princeton Elementary School, Lithonia Middle School, and Lithonia High School.
Ownership History
Date
Name
Owned For
Owner Type
Purchase Details
Closed on
Jul 27, 2017
Sold by
Holmes
Bought by
Konou Selom
Current Estimated Value
Home Financials for this Owner
Home Financials are based on the most recent Mortgage that was taken out on this home.
Original Mortgage
$145,403
Outstanding Balance
$120,772
Interest Rate
3.88%
Mortgage Type
New Conventional
Estimated Equity
$154,987
Purchase Details
Closed on
Apr 4, 2017
Sold by
Scales Shannon K
Bought by
Holmes
Home Financials for this Owner
Home Financials are based on the most recent Mortgage that was taken out on this home.
Original Mortgage
$100,000
Interest Rate
4.21%
Mortgage Type
Purchase Money Mortgage
Purchase Details
Closed on
Nov 15, 2004
Sold by
Legacy Communities Cutters Mil
Bought by
Scales Kelline P and Scales Shannon K
Home Financials for this Owner
Home Financials are based on the most recent Mortgage that was taken out on this home.
Original Mortgage
$28,680
Interest Rate
5.05%
Mortgage Type
Stand Alone Second
Create a Home Valuation Report for This Property
The Home Valuation Report is an in-depth analysis detailing your home's value as well as a comparison with similar homes in the area
Home Values in the Area
Average Home Value in this Area
Purchase History
| Date | Buyer | Sale Price | Title Company |
|---|---|---|---|
| Konou Selom | $149,900 | -- | |
| Holmes | $101,000 | -- | |
| Scales Kelline P | $143,400 | -- |
Source: Public Records
Mortgage History
| Date | Status | Borrower | Loan Amount |
|---|---|---|---|
| Open | Konou Selom | $145,403 | |
| Previous Owner | Holmes | $100,000 | |
| Previous Owner | Scales Kelline P | $28,680 | |
| Previous Owner | Scales Kelline P | $114,720 |
Source: Public Records
Tax History Compared to Growth
Tax History
| Year | Tax Paid | Tax Assessment Tax Assessment Total Assessment is a certain percentage of the fair market value that is determined by local assessors to be the total taxable value of land and additions on the property. | Land | Improvement |
|---|---|---|---|---|
| 2025 | $3,079 | $108,320 | $16,000 | $92,320 |
| 2024 | $2,601 | $84,120 | $8,040 | $76,080 |
| 2023 | $2,601 | $84,120 | $8,040 | $76,080 |
| 2022 | $2,137 | $84,800 | $8,040 | $76,760 |
| 2021 | $2,137 | $67,040 | $8,040 | $59,000 |
| 2020 | $2,102 | $65,320 | $8,040 | $57,280 |
| 2019 | $1,981 | $60,920 | $8,040 | $52,880 |
| 2018 | $1,448 | $56,920 | $8,040 | $48,880 |
| 2017 | $1,646 | $48,240 | $8,040 | $40,200 |
| 2016 | $1,459 | $43,960 | $8,040 | $35,920 |
| 2014 | $959 | $29,400 | $5,240 | $24,160 |
Source: Public Records
Map
Nearby Homes
- 1399 Cutters Mill Dr
- 2150 Mulberry Ln
- 2146 Mulberry Ln Unit 2
- 1324 Sandlewood Ct Unit 2
- 1343 Alice Ave
- 7169 Sweet Gum Ct
- 1777 Cutters Mill Way
- 1793 Cutters Mill Way
- 2019 Mulberry Ln
- 7035 Red Maple Ln
- 1306 Kala Dr
- 1476 Cutters Mill Dr
- 1596 Cutters Mill Dr
- 1593 Cutters Mill Dr
- 1118 Old Greystone Dr
- 1082 Old Greystone Dr
- 1370 Rogers Trace
- 1362 Rogers Trace
- 1512 Rogers Preserve Rd
- 1095 Kingsley Way
- 2103 Mulberry Ln
- 2099 Mulberry Ln
- 2107 Mulberry Ln
- 1360 Persimmon Ct
- 2111 Mulberry Ln Unit 2
- 2111 Mulberry Ln Unit 355
- 2093 Mulberry Ln
- 2106 Mulberry Ln Unit 2
- 2102 Mulberry Ln
- 1366 Persimmon Ct Unit 2
- 1348 Persimmon Ct Unit 2
- 2110 Mulberry Ln Unit 186
- 2110 Mulberry Ln
- 2098 Mulberry Ln
- 2087 Mulberry Ln
- 2115 Mulberry Ln Unit 2
- 1372 Persimmon Ct Unit 2
- 2094 Mulberry Ln
- 2094 Mulberry Ln Unit 2094
- 1291 Cypress Trace Unit 2