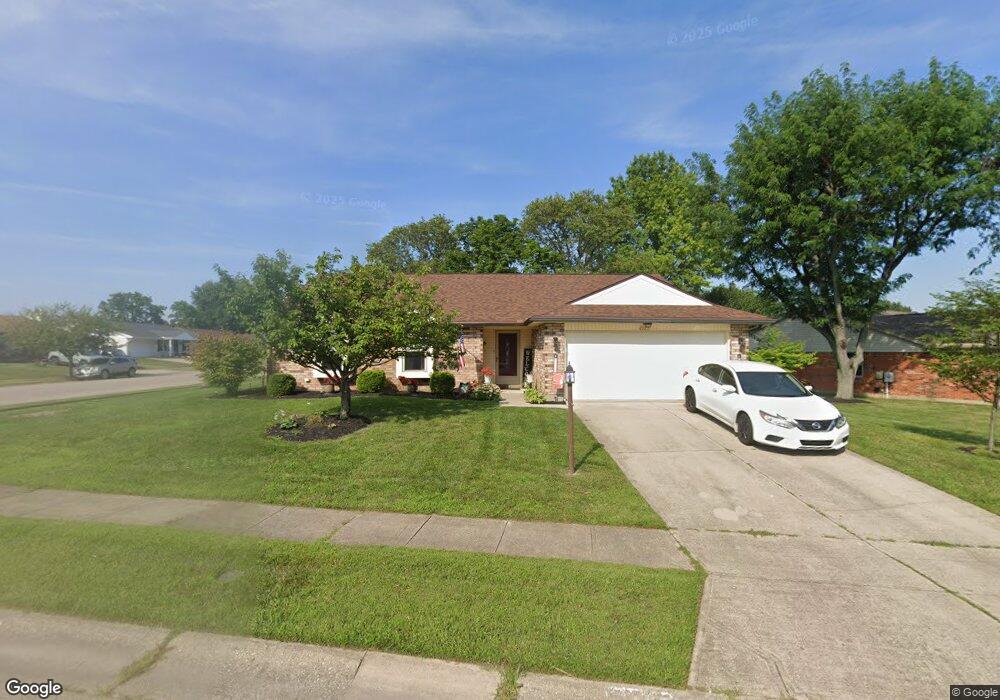
2103 Sir Lockesley Dr Miamisburg, OH 45342
Estimated Value: $264,000 - $303,000
3
Beds
2
Baths
1,574
Sq Ft
$181/Sq Ft
Est. Value
About This Home
This home is located at 2103 Sir Lockesley Dr, Miamisburg, OH 45342 and is currently estimated at $285,077, approximately $181 per square foot. 2103 Sir Lockesley Dr is a home located in Montgomery County with nearby schools including Miamisburg High School and Bethel Baptist School.
Ownership History
Date
Name
Owned For
Owner Type
Purchase Details
Closed on
Oct 8, 2024
Sold by
Ellis Mark A and Ellis Regina G
Bought by
Mullenix Michael Thomas and Mccane Toni Marie
Current Estimated Value
Home Financials for this Owner
Home Financials are based on the most recent Mortgage that was taken out on this home.
Original Mortgage
$252,000
Outstanding Balance
$249,233
Interest Rate
6.12%
Mortgage Type
New Conventional
Estimated Equity
$35,844
Purchase Details
Closed on
May 1, 2020
Sold by
Morningstar Joan E
Bought by
Ellis Mark A and Ellis Regina G
Home Financials for this Owner
Home Financials are based on the most recent Mortgage that was taken out on this home.
Original Mortgage
$157,700
Interest Rate
3.5%
Mortgage Type
New Conventional
Create a Home Valuation Report for This Property
The Home Valuation Report is an in-depth analysis detailing your home's value as well as a comparison with similar homes in the area
Home Values in the Area
Average Home Value in this Area
Purchase History
| Date | Buyer | Sale Price | Title Company |
|---|---|---|---|
| Mullenix Michael Thomas | $280,000 | Landmark Title | |
| Mullenix Michael Thomas | $280,000 | Landmark Title | |
| Ellis Mark A | $166,000 | Home Services Title Llc |
Source: Public Records
Mortgage History
| Date | Status | Borrower | Loan Amount |
|---|---|---|---|
| Open | Mullenix Michael Thomas | $252,000 | |
| Closed | Mullenix Michael Thomas | $252,000 | |
| Previous Owner | Ellis Mark A | $157,700 |
Source: Public Records
Tax History Compared to Growth
Tax History
| Year | Tax Paid | Tax Assessment Tax Assessment Total Assessment is a certain percentage of the fair market value that is determined by local assessors to be the total taxable value of land and additions on the property. | Land | Improvement |
|---|---|---|---|---|
| 2024 | $3,972 | $62,540 | $14,490 | $48,050 |
| 2023 | $3,972 | $62,540 | $14,490 | $48,050 |
| 2022 | $3,927 | $52,120 | $12,080 | $40,040 |
| 2021 | $3,473 | $52,120 | $12,080 | $40,040 |
| 2020 | $2,890 | $52,120 | $12,080 | $40,040 |
| 2019 | $2,654 | $45,310 | $10,500 | $34,810 |
| 2018 | $2,663 | $45,310 | $10,500 | $34,810 |
| 2017 | $2,645 | $45,310 | $10,500 | $34,810 |
| 2016 | $2,358 | $40,140 | $10,500 | $29,640 |
| 2015 | $2,312 | $40,140 | $10,500 | $29,640 |
| 2014 | $2,312 | $40,140 | $10,500 | $29,640 |
| 2012 | -- | $40,720 | $13,300 | $27,420 |
Source: Public Records
Map
Nearby Homes
- 1803 Cudgell Dr
- 838 Maid Marion Ct
- 2125 Sherwood Forest Dr
- 857 Lea Castle Place
- 2302 King Richard Pkwy
- 700 N Gebhart Church Rd
- 429 Wilson Park Dr
- 1100 S Elm St
- 703 Friar Tuck Ct
- 1109 Sundance Dr
- 1000 Skyview Dr
- 524 N Lindsey Ave
- 2061 Pine Forest Dr
- 609 Kings Cross Ct
- 516 N Lindsey Ave
- 514 N Lindsey Ave
- 432 Crusader Dr
- 500 Lincoln Green Dr
- 1678 Carolyn Dr
- 722 Peach Orchard Dr
- 2105 Sir Lockesley Dr
- 1918 Sherwood Forest Dr
- 2107 Sir Lockesley Dr
- 1911 Sherwood Forest Dr
- 1901 Sherwood Forest Dr
- 2102 Sir Lockesley Dr
- 1924 Sherwood Forest Dr
- 1921 Sherwood Forest Dr
- 1821 Sherwood Forest Dr
- 2106 Sir Lockesley Dr
- 2104 Sir Lockesley Dr
- 2109 Sir Lockesley Dr
- 2108 Sir Lockesley Dr
- 1902 Cudgell Dr
- 1812 Sherwood Forest Dr
- 1931 Sherwood Forest Dr
- 2102 Lion Heart Dr
- 1811 Sherwood Forest Dr
- 1836 Cudgell Dr
- 2110 Sir Lockesley Dr