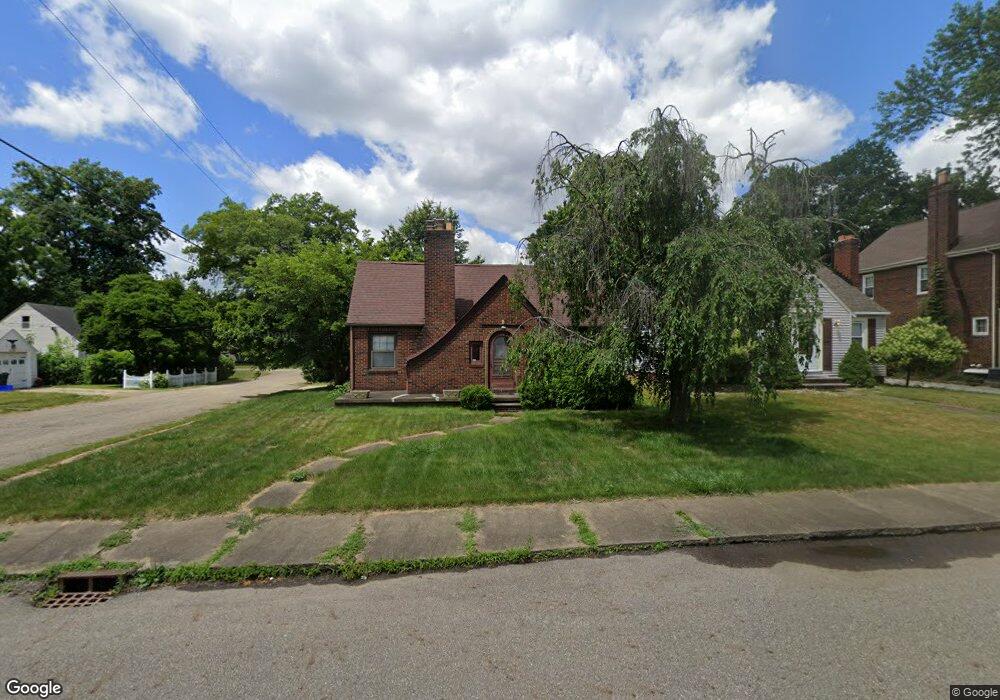
2103 Spring Ave NE Canton, OH 44714
Colonial Heights NeighborhoodEstimated Value: $144,000 - $204,000
3
Beds
1
Bath
1,523
Sq Ft
$109/Sq Ft
Est. Value
About This Home
This home is located at 2103 Spring Ave NE, Canton, OH 44714 and is currently estimated at $165,758, approximately $108 per square foot. 2103 Spring Ave NE is a home located in Stark County with nearby schools including Belle Stone Elementary School, Early Learning Center @ Schreiber, and Youtz Intermediate School.
Ownership History
Date
Name
Owned For
Owner Type
Purchase Details
Closed on
Mar 24, 2021
Sold by
Simmonds George
Bought by
Bode Tiffany and Neff Walter
Current Estimated Value
Home Financials for this Owner
Home Financials are based on the most recent Mortgage that was taken out on this home.
Original Mortgage
$141,391
Outstanding Balance
$126,811
Interest Rate
2.73%
Mortgage Type
FHA
Estimated Equity
$38,947
Purchase Details
Closed on
Nov 23, 2020
Sold by
Still Candice L
Bought by
Simmonds George
Purchase Details
Closed on
Apr 25, 2005
Sold by
Kurzinsky David B and Kurzinsky Kim M
Bought by
Still Candice L
Home Financials for this Owner
Home Financials are based on the most recent Mortgage that was taken out on this home.
Original Mortgage
$65,000
Interest Rate
5.89%
Mortgage Type
Fannie Mae Freddie Mac
Purchase Details
Closed on
Apr 10, 1990
Create a Home Valuation Report for This Property
The Home Valuation Report is an in-depth analysis detailing your home's value as well as a comparison with similar homes in the area
Home Values in the Area
Average Home Value in this Area
Purchase History
| Date | Buyer | Sale Price | Title Company |
|---|---|---|---|
| Bode Tiffany | $144,000 | Fireland Title | |
| Simmonds George | $93,500 | Fireland Title | |
| Still Candice L | $104,900 | Real Living Title Agency Ltd | |
| -- | $53,200 | -- |
Source: Public Records
Mortgage History
| Date | Status | Borrower | Loan Amount |
|---|---|---|---|
| Open | Bode Tiffany | $141,391 | |
| Previous Owner | Still Candice L | $65,000 |
Source: Public Records
Tax History
| Year | Tax Paid | Tax Assessment Tax Assessment Total Assessment is a certain percentage of the fair market value that is determined by local assessors to be the total taxable value of land and additions on the property. | Land | Improvement |
|---|---|---|---|---|
| 2025 | -- | $41,340 | $9,280 | $32,060 |
| 2024 | -- | $41,340 | $9,280 | $32,060 |
| 2023 | $1,912 | $31,370 | $4,660 | $26,710 |
| 2022 | $1,861 | $31,370 | $4,660 | $26,710 |
| 2021 | $1,880 | $31,370 | $4,660 | $26,710 |
| 2020 | $1,663 | $25,380 | $3,750 | $21,630 |
| 2019 | $1,452 | $25,380 | $3,750 | $21,630 |
Source: Public Records
Map
Nearby Homes
- 1022 19th St NE
- 1805 Gibbs Ave NE
- 1218 24th St NE
- 0 Rowland Ave NE Unit 5089960
- 2219 Rowland Ave NE
- 1716 Gibbs Ave NE
- 253 23rd St NW
- 321 19th St NW
- 1629 Gibbs Ave NE
- 1717 Harvard Ave NW
- 1115 Colonial Blvd NE
- 804 28th St NE
- 1416 19th St NE
- 603 15th St NE
- 1521 Gibbs Ave NE
- 2015 Gross Ave NE
- 1454 Spring Ave NE
- 1410 Colonial Blvd NE
- 1610 23rd St NE
- 1421 Market Ave N
- 2107 Spring Ave NE
- 140 21st St NE
- 2111 Spring Ave NE
- 129 21st St NE
- 130 21st St NE
- 705 21st St NE
- 2023 Spring Ave NE
- 2129 Spring Ave NE
- 2106 Spring Ave NE
- 2026 Spring Ave NE
- 124 21st St NE
- 2011 Spring Ave NE
- 2130 Market Ave N
- 2210 Market Ave N
- 702 22nd St NE
- 715 21st St NE
- 715 21st St NE
- 2003 Spring Ave NE
- 2003 Spring Ave NE
- 2010 Spring Ave NE
Your Personal Tour Guide
Ask me questions while you tour the home.