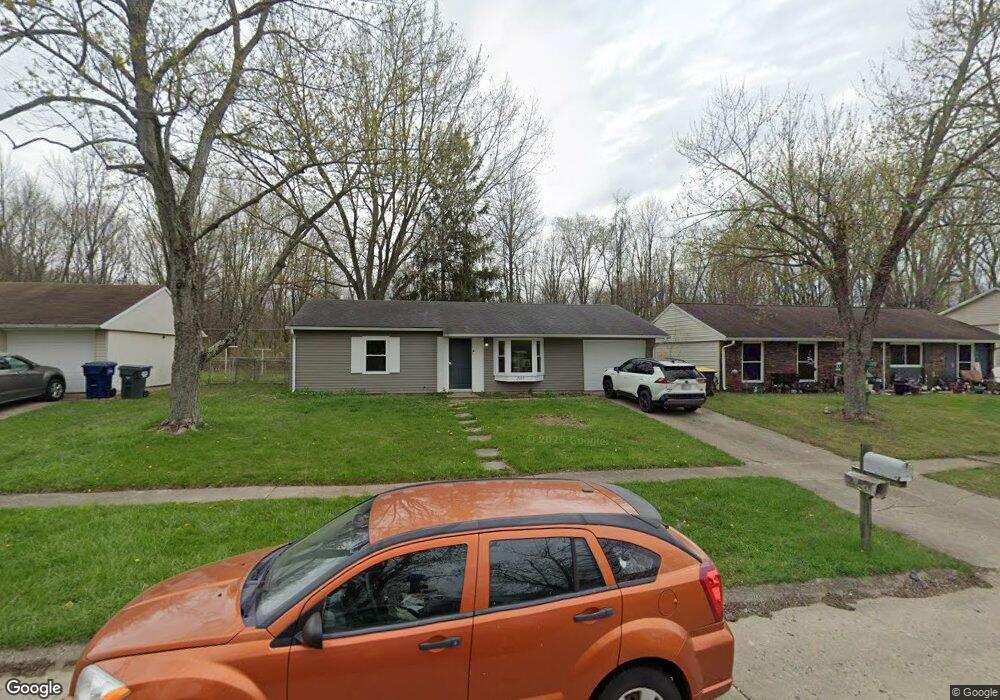
2103 Tamarack Rd Anderson, IN 46011
Estimated Value: $107,000 - $137,930
3
Beds
1
Bath
900
Sq Ft
$138/Sq Ft
Est. Value
About This Home
This home is located at 2103 Tamarack Rd, Anderson, IN 46011 and is currently estimated at $123,983, approximately $137 per square foot. 2103 Tamarack Rd is a home located in Madison County with nearby schools including Edgewood Elementary School, Highland Middle School, and Anderson High School.
Ownership History
Date
Name
Owned For
Owner Type
Purchase Details
Closed on
Nov 22, 2017
Sold by
Johnson Bobbi L
Bought by
Niccolini Robert Drew
Current Estimated Value
Home Financials for this Owner
Home Financials are based on the most recent Mortgage that was taken out on this home.
Original Mortgage
$40,860
Outstanding Balance
$34,158
Interest Rate
3.94%
Mortgage Type
VA
Estimated Equity
$89,825
Create a Home Valuation Report for This Property
The Home Valuation Report is an in-depth analysis detailing your home's value as well as a comparison with similar homes in the area
Home Values in the Area
Average Home Value in this Area
Purchase History
| Date | Buyer | Sale Price | Title Company |
|---|---|---|---|
| Niccolini Robert Drew | -- | -- |
Source: Public Records
Mortgage History
| Date | Status | Borrower | Loan Amount |
|---|---|---|---|
| Open | Niccolini Robert Drew | $40,860 |
Source: Public Records
Tax History Compared to Growth
Tax History
| Year | Tax Paid | Tax Assessment Tax Assessment Total Assessment is a certain percentage of the fair market value that is determined by local assessors to be the total taxable value of land and additions on the property. | Land | Improvement |
|---|---|---|---|---|
| 2025 | $757 | $71,700 | $11,600 | $60,100 |
| 2024 | $757 | $71,700 | $11,600 | $60,100 |
| 2023 | $700 | $65,600 | $11,100 | $54,500 |
| 2022 | $753 | $70,300 | $10,800 | $59,500 |
| 2021 | $669 | $62,200 | $10,200 | $52,000 |
| 2020 | $612 | $56,700 | $9,800 | $46,900 |
| 2019 | $580 | $53,700 | $9,800 | $43,900 |
| 2018 | $551 | $50,400 | $9,800 | $40,600 |
| 2017 | $481 | $47,500 | $9,500 | $38,000 |
| 2016 | $955 | $46,500 | $9,400 | $37,100 |
| 2014 | $855 | $42,500 | $8,700 | $33,800 |
| 2013 | $855 | $42,500 | $8,700 | $33,800 |
Source: Public Records
Map
Nearby Homes
- 1905 E Balsam Ct
- 2415 Bramble Way
- 1641 Hillcrest Ave
- Lot 2 Vanderbilt Dr
- Lot 34 Doe Meadow Dr
- Lot 33 Doe Meadow Dr
- Lot 28 Doe Meadow Dr
- 2407 Caramore Cir
- 1321 Greenway Dr
- 925 Forest Dr
- 807 Forest Dr
- 1820 Whittier Ave
- 2515 Winterwood Ct
- 1907 Lowell Ave
- 1110 van Buskirk Rd
- 2158 W 250 N
- 2511 Winterwood Ln
- 2525 Winterwood Ln
- 2519 Winterwood Ln
- 2526 Winterwood Ln
- 2107 Tamarack Rd
- 2027 Tamarack Rd
- 2111 Tamarack Rd
- 2023 Tamarack Rd
- 2104 Tamarack Rd
- 2028 Tamarack Rd
- 2019 Tamarack Rd
- 2115 Tamarack Rd
- 2108 Tamarack Rd
- 2112 Tamarack Rd
- 2020 Tamarack Rd
- 2015 Tamarack Rd
- 2116 Tamarack Rd
- 2119 Tamarack Rd
- 2012 Tamarack Rd
- 2011 Tamarack Rd
- 2120 Tamarack Rd
- 1708 Raintree Dr
- 2123 Tamarack Rd
- 1616 Raintree Dr