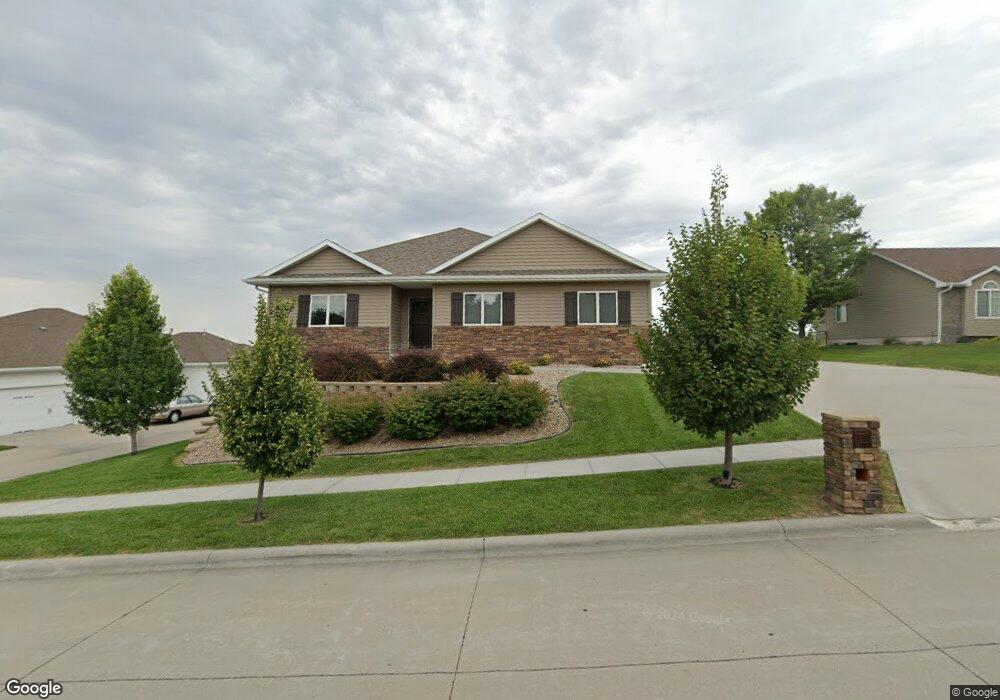
2103 W 49th St Kearney, NE 68845
Estimated Value: $450,000 - $501,000
5
Beds
3
Baths
1,500
Sq Ft
$314/Sq Ft
Est. Value
About This Home
This home is located at 2103 W 49th St, Kearney, NE 68845 and is currently estimated at $470,781, approximately $313 per square foot. 2103 W 49th St is a home located in Buffalo County with nearby schools including Windy Hills Elementary School, Horizon Middle School, and Kearney Senior High School.
Ownership History
Date
Name
Owned For
Owner Type
Purchase Details
Closed on
Feb 2, 2023
Sold by
Payne Trevor and Payne Lindsay
Bought by
Sleigh Dean M and Sleigh Jeanie M
Current Estimated Value
Home Financials for this Owner
Home Financials are based on the most recent Mortgage that was taken out on this home.
Original Mortgage
$429,660
Outstanding Balance
$415,584
Interest Rate
6.09%
Mortgage Type
VA
Estimated Equity
$55,197
Purchase Details
Closed on
Jun 7, 2017
Sold by
Nebraska Land Development Llc
Bought by
Payne Trevor
Purchase Details
Closed on
Oct 14, 2015
Sold by
Golden Eye Properties Llc
Bought by
Nebraska Land Development Llc
Purchase Details
Closed on
Jan 20, 2006
Sold by
Triad Land Developemtn Inc
Bought by
Sd Miller Construction Inc
Home Financials for this Owner
Home Financials are based on the most recent Mortgage that was taken out on this home.
Original Mortgage
$25,200
Interest Rate
6.25%
Create a Home Valuation Report for This Property
The Home Valuation Report is an in-depth analysis detailing your home's value as well as a comparison with similar homes in the area
Home Values in the Area
Average Home Value in this Area
Purchase History
| Date | Buyer | Sale Price | Title Company |
|---|---|---|---|
| Sleigh Dean M | $420,000 | Central Nebraska Title | |
| Payne Trevor | -- | Vintage Title | |
| Nebraska Land Development Llc | -- | Vintage Title | |
| Sd Miller Construction Inc | $28,000 | -- |
Source: Public Records
Mortgage History
| Date | Status | Borrower | Loan Amount |
|---|---|---|---|
| Open | Sleigh Dean M | $429,660 | |
| Previous Owner | Sd Miller Construction Inc | $25,200 |
Source: Public Records
Tax History Compared to Growth
Tax History
| Year | Tax Paid | Tax Assessment Tax Assessment Total Assessment is a certain percentage of the fair market value that is determined by local assessors to be the total taxable value of land and additions on the property. | Land | Improvement |
|---|---|---|---|---|
| 2025 | $5,145 | $403,975 | $67,645 | $336,330 |
| 2024 | $5,145 | $387,005 | $65,675 | $321,330 |
| 2023 | $6,067 | $356,495 | $65,675 | $290,820 |
| 2022 | $5,310 | $302,605 | $62,585 | $240,020 |
| 2021 | $4,845 | $280,930 | $53,470 | $227,460 |
| 2020 | $4,907 | $283,685 | $53,470 | $230,215 |
| 2019 | $4,917 | $280,830 | $53,470 | $227,360 |
| 2018 | $4,982 | $288,650 | $53,470 | $235,180 |
| 2017 | $2,547 | $148,565 | $53,470 | $95,095 |
| 2016 | $1,419 | $83,470 | $53,470 | $30,000 |
| 2015 | $974 | $56,005 | $0 | $0 |
| 2014 | $484 | $25,400 | $0 | $0 |
Source: Public Records
Map
Nearby Homes
- TBD Lot 11 Block 4
- TBD Lot 5 Block 3
- TBD Lt 4 Block 3
- TBD Lot 2 Block 3
- TBD Lot 3 Block 3
- TBD Lot 1 Block 3
- TBD Lot 2 Block 4
- TBD Lot 3 Block 2
- TBD Lt 2 Block 2
- TBD Lot 1 Block 2
- 1707 W 43rd Street Place
- Lot 6 Block 2 Fountain Hills 5th Additon
- 4606 15th Avenue Place
- Lot 1 Block 2 Fountain Hills 5th Addition
- 4727 29th Ave
- 17th 56th Street Tract B Unit Tract B
- 17th 56th Street Tract A Unit Tract A
- TBD Country Club Ln Unit L10B2 Spruce Hollow
- L3B3 Country Club Ln
- 4732 29th Ave