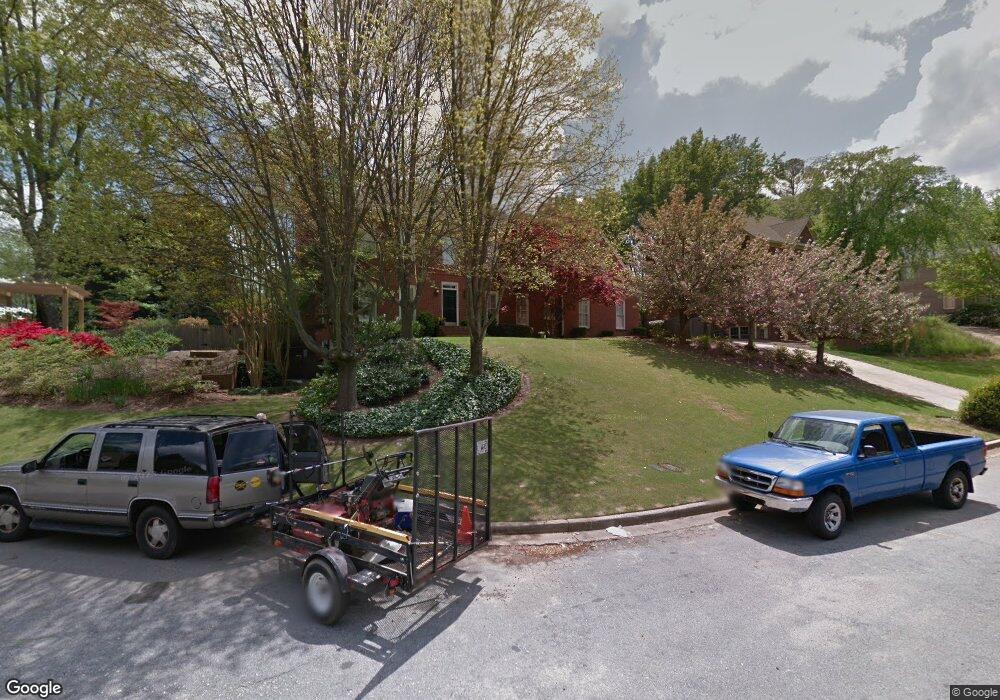
2103 Westover Plantation Atlanta, GA 30338
Estimated Value: $862,543 - $983,000
5
Beds
5
Baths
2,881
Sq Ft
$314/Sq Ft
Est. Value
About This Home
This home is located at 2103 Westover Plantation, Atlanta, GA 30338 and is currently estimated at $904,886, approximately $314 per square foot. 2103 Westover Plantation is a home located in DeKalb County with nearby schools including Kingsley Elementary School, Peachtree Middle School, and Dunwoody High School.
Ownership History
Date
Name
Owned For
Owner Type
Purchase Details
Closed on
Mar 27, 2023
Sold by
Campbell Jennifer Anne
Bought by
Larimer Robert Walter and Larimer Tylisha
Current Estimated Value
Home Financials for this Owner
Home Financials are based on the most recent Mortgage that was taken out on this home.
Original Mortgage
$595,200
Outstanding Balance
$577,724
Interest Rate
6.5%
Mortgage Type
New Conventional
Estimated Equity
$327,162
Purchase Details
Closed on
Sep 1, 2022
Sold by
Campbell Jennifer A Exec
Bought by
Campbell Jennifer and Jennifer Campbell Descandants Tr
Purchase Details
Closed on
Dec 3, 1993
Sold by
Lane Gary M
Bought by
Campbell Charles H
Home Financials for this Owner
Home Financials are based on the most recent Mortgage that was taken out on this home.
Original Mortgage
$133,000
Interest Rate
7.09%
Create a Home Valuation Report for This Property
The Home Valuation Report is an in-depth analysis detailing your home's value as well as a comparison with similar homes in the area
Home Values in the Area
Average Home Value in this Area
Purchase History
| Date | Buyer | Sale Price | Title Company |
|---|---|---|---|
| Larimer Robert Walter | $744,000 | -- | |
| Campbell Jennifer | -- | -- | |
| Campbell Charles H | $333,000 | -- |
Source: Public Records
Mortgage History
| Date | Status | Borrower | Loan Amount |
|---|---|---|---|
| Open | Larimer Robert Walter | $595,200 | |
| Previous Owner | Campbell Charles H | $133,000 |
Source: Public Records
Tax History Compared to Growth
Tax History
| Year | Tax Paid | Tax Assessment Tax Assessment Total Assessment is a certain percentage of the fair market value that is determined by local assessors to be the total taxable value of land and additions on the property. | Land | Improvement |
|---|---|---|---|---|
| 2025 | $8,419 | $309,160 | $54,000 | $255,160 |
| 2024 | $8,054 | $286,040 | $54,000 | $232,040 |
| 2023 | $8,054 | $246,120 | $54,000 | $192,120 |
| 2022 | $6,550 | $239,680 | $54,000 | $185,680 |
| 2021 | $5,412 | $193,800 | $54,000 | $139,800 |
| 2020 | $4,974 | $169,720 | $54,000 | $115,720 |
| 2019 | $4,677 | $161,000 | $54,000 | $107,000 |
| 2018 | $4,845 | $163,520 | $32,680 | $130,840 |
| 2017 | $5,095 | $150,120 | $32,680 | $117,440 |
| 2016 | $4,878 | $151,760 | $32,680 | $119,080 |
| 2014 | $4,830 | $147,320 | $32,600 | $114,720 |
Source: Public Records
Map
Nearby Homes
- 5231 Seaton Dr
- 5401 Seaton Way
- 5015 Oakhurst Walk
- 5145 Davantry Dr
- 5212 Falkirk Dr
- 2220 Spring Mill Cove
- 4942 Lakeland Woods Ct
- 1971 Wellesley Trace
- 1983 Wellesley Trace
- 5004 Delverton Ct Unit 8
- 5513 N Peachtree Rd
- 1850 E Gate Cove
- 5318 Brooke Farm Dr
- 2293 Littlebrooke Trace
- 1933 Rotherham Way
- 5284 Brookelake Dr
- 5417 Trentham Dr
- 2093 Westover Plantation
- 2124 Stephens Walk
- 2132 Stephens Walk
- 2109 Westover Plantation
- 2116 Stephens Walk
- 2100 Westover Plantation
- 2140 Stephens Walk
- 2085 Westover Plantation
- 2090 Westover Plantation
- 2108 Stephens Walk
- 2110 Westover Plantation
- 2125 Stephens Walk
- 2133 Stephens Walk
- 2148 Stephens Walk
- 2080 Westover Plantation
- 2100 Stephens Walk
- 5109 Sheridan Ln
- 2073 Westover Plantation Unit 2
- 2073 Westover Plantation
- 2109 Stephens Walk