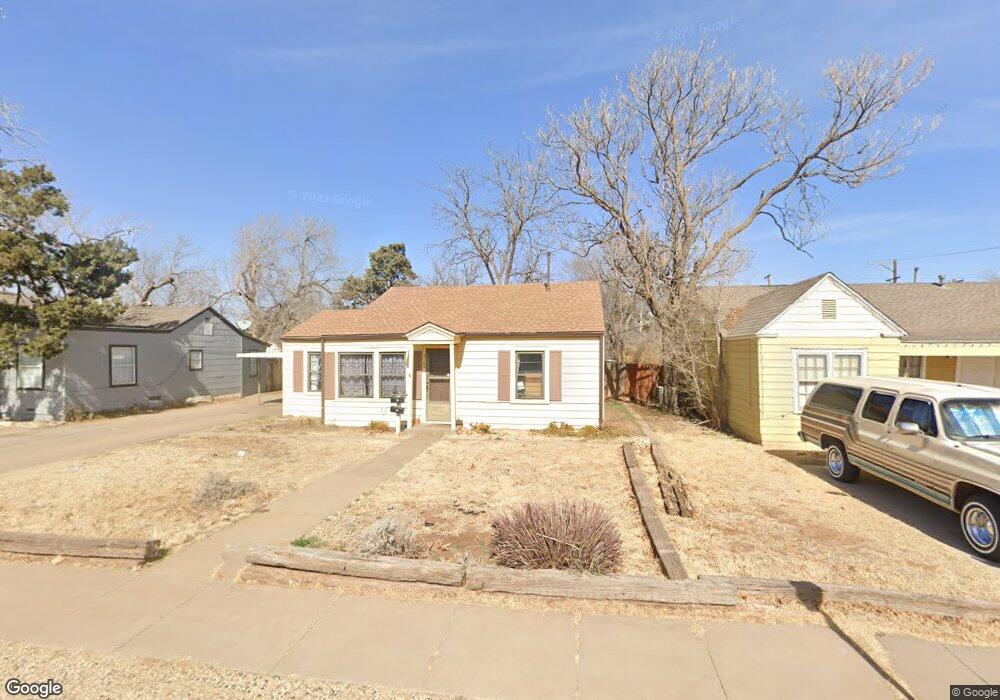
2104 32nd St Lubbock, TX 79411
Heart of Lubbock NeighborhoodEstimated Value: $109,000 - $132,423
3
Beds
1
Bath
1,334
Sq Ft
$91/Sq Ft
Est. Value
About This Home
This home is located at 2104 32nd St, Lubbock, TX 79411 and is currently estimated at $120,856, approximately $90 per square foot. 2104 32nd St is a home located in Lubbock County with nearby schools including Brown Elementary School, Dupre Elementary School, and Slaton Middle School.
Ownership History
Date
Name
Owned For
Owner Type
Purchase Details
Closed on
Feb 7, 2019
Sold by
Emcazaee Holdings Llc
Bought by
West Caleb
Current Estimated Value
Home Financials for this Owner
Home Financials are based on the most recent Mortgage that was taken out on this home.
Original Mortgage
$70,000
Outstanding Balance
$61,543
Interest Rate
4.5%
Mortgage Type
Purchase Money Mortgage
Estimated Equity
$59,313
Purchase Details
Closed on
Dec 12, 2016
Sold by
Secretary Of Housing And Urban Developme
Bought by
Emenzale Holding Llc
Purchase Details
Closed on
Aug 12, 2016
Sold by
Mcmurry Margret and Mcmurry Margaret Brirc
Bought by
The Secretray Of Housing And Urban Deveo
Home Financials for this Owner
Home Financials are based on the most recent Mortgage that was taken out on this home.
Original Mortgage
$115,500
Interest Rate
3.43%
Mortgage Type
Reverse Mortgage Home Equity Conversion Mortgage
Create a Home Valuation Report for This Property
The Home Valuation Report is an in-depth analysis detailing your home's value as well as a comparison with similar homes in the area
Home Values in the Area
Average Home Value in this Area
Purchase History
| Date | Buyer | Sale Price | Title Company |
|---|---|---|---|
| West Caleb | -- | Service Title | |
| Emenzale Holding Llc | -- | None Available | |
| The Secretray Of Housing And Urban Deveo | -- | None Available |
Source: Public Records
Mortgage History
| Date | Status | Borrower | Loan Amount |
|---|---|---|---|
| Open | West Caleb | $70,000 | |
| Previous Owner | The Secretray Of Housing And Urban Deveo | $115,500 |
Source: Public Records
Tax History Compared to Growth
Tax History
| Year | Tax Paid | Tax Assessment Tax Assessment Total Assessment is a certain percentage of the fair market value that is determined by local assessors to be the total taxable value of land and additions on the property. | Land | Improvement |
|---|---|---|---|---|
| 2025 | $2,401 | $134,824 | $25,000 | $109,824 |
| 2024 | $2,401 | $139,216 | $25,000 | $114,216 |
| 2023 | $2,048 | $121,743 | $13,650 | $108,093 |
| 2022 | $2,301 | $113,667 | $13,650 | $100,017 |
| 2021 | $1,840 | $85,937 | $13,650 | $72,287 |
| 2020 | $1,893 | $87,067 | $13,650 | $73,417 |
| 2019 | $1,701 | $75,772 | $13,650 | $62,122 |
| 2018 | $1,767 | $78,596 | $13,650 | $64,946 |
| 2017 | $1,305 | $57,998 | $2,750 | $55,248 |
| 2015 | $247 | $65,265 | $2,750 | $62,515 |
| 2014 | $247 | $61,718 | $2,750 | $58,968 |
Source: Public Records
Map
Nearby Homes