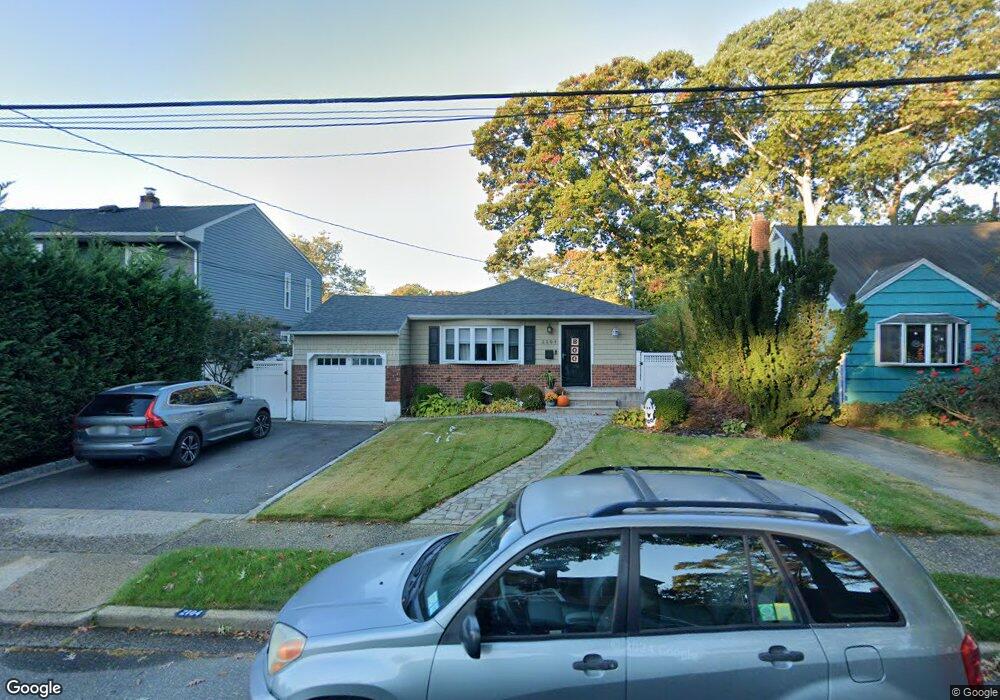
2104 Lindgren St Merrick, NY 11566
Estimated Value: $621,000 - $707,923
3
Beds
1
Bath
1,050
Sq Ft
$633/Sq Ft
Est. Value
About This Home
This home is located at 2104 Lindgren St, Merrick, NY 11566 and is currently estimated at $664,462, approximately $632 per square foot. 2104 Lindgren St is a home located in Nassau County with nearby schools including Merrick Avenue Middle School, Sanford H Calhoun High School, and Grace Christian Academy.
Ownership History
Date
Name
Owned For
Owner Type
Purchase Details
Closed on
Aug 26, 2020
Sold by
Giannotta Daniel
Bought by
Giannotta Daniel and Claase Nicole E
Current Estimated Value
Purchase Details
Closed on
Oct 23, 2017
Sold by
Owb Reo Llc
Bought by
Giannotta Daniel
Home Financials for this Owner
Home Financials are based on the most recent Mortgage that was taken out on this home.
Original Mortgage
$332,910
Outstanding Balance
$278,520
Interest Rate
3.88%
Mortgage Type
New Conventional
Estimated Equity
$385,942
Purchase Details
Closed on
Feb 23, 2016
Sold by
Referee Of Nassau County and Damm
Bought by
Owb Reo Llc
Purchase Details
Closed on
Jun 11, 2008
Sold by
Lamb Patricia
Bought by
Kwon Peter
Purchase Details
Closed on
Jan 25, 2001
Sold by
Clement Thomas E
Bought by
Lamb Patricia
Create a Home Valuation Report for This Property
The Home Valuation Report is an in-depth analysis detailing your home's value as well as a comparison with similar homes in the area
Home Values in the Area
Average Home Value in this Area
Purchase History
| Date | Buyer | Sale Price | Title Company |
|---|---|---|---|
| Giannotta Daniel | -- | None Available | |
| Giannotta Daniel | -- | None Available | |
| Giannotta Daniel | $370,000 | Fidelity National Title | |
| Giannotta Daniel | $370,000 | Fidelity National Title | |
| Owb Reo Llc | $330,146 | Web Title Agency | |
| Owb Reo Llc | $330,146 | Web Title Agency | |
| Kwon Peter | $438,000 | -- | |
| Kwon Peter | $438,000 | -- | |
| Lamb Patricia | $243,500 | Anthony Fonseca | |
| Lamb Patricia | $243,500 | Anthony Fonseca |
Source: Public Records
Mortgage History
| Date | Status | Borrower | Loan Amount |
|---|---|---|---|
| Open | Giannotta Daniel | $332,910 | |
| Closed | Giannotta Daniel | $332,910 | |
| Closed | Owb Reo Llc | $0 |
Source: Public Records
Tax History Compared to Growth
Tax History
| Year | Tax Paid | Tax Assessment Tax Assessment Total Assessment is a certain percentage of the fair market value that is determined by local assessors to be the total taxable value of land and additions on the property. | Land | Improvement |
|---|---|---|---|---|
| 2025 | $12,476 | $411 | $166 | $245 |
| 2024 | $2,762 | $406 | $164 | $242 |
| 2023 | $11,451 | $428 | $173 | $255 |
| 2022 | $11,451 | $445 | $180 | $265 |
| 2021 | $15,978 | $464 | $188 | $276 |
| 2020 | $12,345 | $631 | $419 | $212 |
| 2019 | $3,911 | $841 | $558 | $283 |
| 2018 | $3,732 | $841 | $0 | $0 |
| 2017 | $9,677 | $841 | $558 | $283 |
| 2016 | $13,276 | $841 | $558 | $283 |
| 2015 | $3,337 | $841 | $558 | $283 |
| 2014 | $3,337 | $841 | $558 | $283 |
| 2013 | $3,158 | $841 | $558 | $283 |
Source: Public Records
Map
Nearby Homes
- 1818 Gormley Ave
- 25 Babylon Turnpike
- 96 Thelma Ave
- 1931 Miller Place
- 1729 Gormley Ave
- 1707 Carroll Ave
- 1938 Meadowbrook Rd
- 2291 Girard Place
- 2991 Girard Place
- 1690 Argyle Rd
- 1922 Horatio Ave
- 78 Jesse St
- 9 Troy Place
- 131 Gregory Ave
- 1824 Gildersleeve St
- 45 Lakeview Ave
- 19 Margaret Blvd
- 1674 Birch Dr
- 1800 Remson Ave
- 49 Princeton Place
- 2054 Lindgren St
- 39 Lindgren St
- 20 Pearsall Place
- 2050 Lindgren St
- 2116 Lindgren St
- 1785 Grand Ave
- 24 Pearsall Place
- 30 Pearsall Place
- 2115 Lindgren St
- 1779 Grand Ave
- 2059 Lindgren St
- 2044 Lindgren St
- 2053 Lindgren St
- 36 Pearsall Place
- 1801 Grand Ave
- 2040 Lindgren St
- 2045 Lindgren St
- 1790 Grand Ave
- 2080 Lindgren St
- 42 Pearsall Place