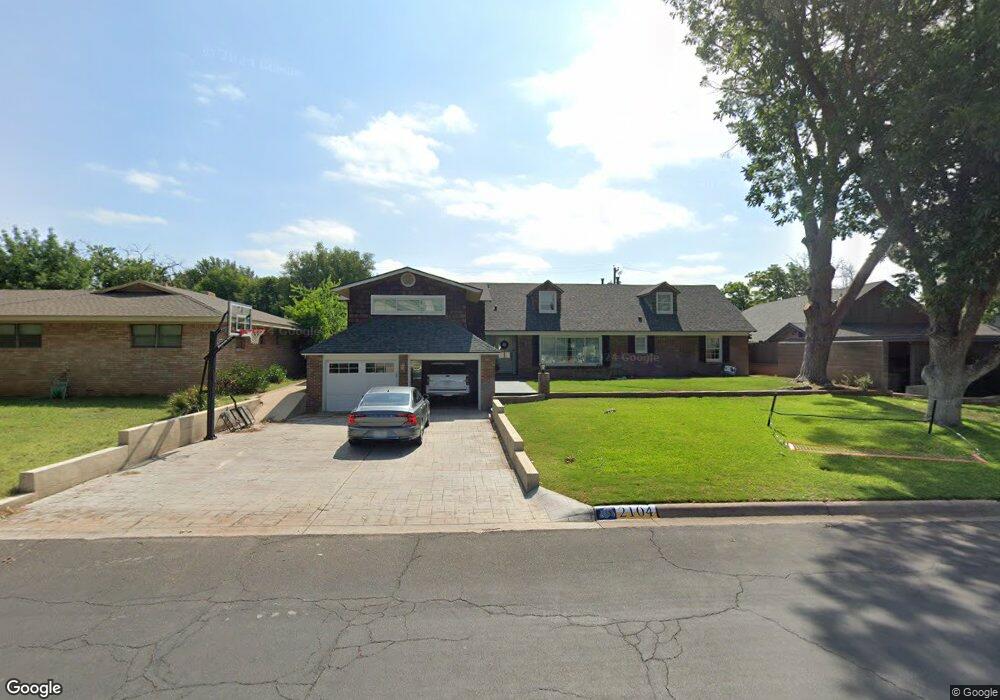
2104 N I St Midland, TX 79705
Estimated Value: $617,000 - $807,000
5
Beds
3
Baths
3,923
Sq Ft
$187/Sq Ft
Est. Value
About This Home
This home is located at 2104 N I St, Midland, TX 79705 and is currently estimated at $731,809, approximately $186 per square foot. 2104 N I St is a home located in Midland County with nearby schools including Fannin Elementary School, Midland High School, and Midland Academy Charter School.
Ownership History
Date
Name
Owned For
Owner Type
Purchase Details
Closed on
Sep 12, 2023
Sold by
Lee Jared O and Lee Stephanie D
Bought by
Hammond Phillip and Hammond Emily M
Current Estimated Value
Home Financials for this Owner
Home Financials are based on the most recent Mortgage that was taken out on this home.
Original Mortgage
$565,600
Outstanding Balance
$553,437
Interest Rate
7.12%
Estimated Equity
$178,372
Purchase Details
Closed on
May 12, 2016
Sold by
Jones Stephen J
Bought by
Lee Jared I
Purchase Details
Closed on
May 8, 2007
Sold by
Cristiani Michael and Cristiani Jonell
Bought by
Jones Stephen J and Jones Diana
Home Financials for this Owner
Home Financials are based on the most recent Mortgage that was taken out on this home.
Original Mortgage
$224,000
Interest Rate
6.13%
Mortgage Type
Purchase Money Mortgage
Purchase Details
Closed on
Dec 21, 1979
Bought by
Lee Jared I
Create a Home Valuation Report for This Property
The Home Valuation Report is an in-depth analysis detailing your home's value as well as a comparison with similar homes in the area
Home Values in the Area
Average Home Value in this Area
Purchase History
| Date | Buyer | Sale Price | Title Company |
|---|---|---|---|
| Hammond Phillip | -- | West Texas Abstract & Title | |
| Lee Jared I | -- | -- | |
| Jones Stephen J | -- | Lone Star Abstract & Title C | |
| Lee Jared I | -- | -- |
Source: Public Records
Mortgage History
| Date | Status | Borrower | Loan Amount |
|---|---|---|---|
| Open | Hammond Phillip | $565,600 | |
| Previous Owner | Jones Stephen J | $224,000 |
Source: Public Records
Tax History Compared to Growth
Tax History
| Year | Tax Paid | Tax Assessment Tax Assessment Total Assessment is a certain percentage of the fair market value that is determined by local assessors to be the total taxable value of land and additions on the property. | Land | Improvement |
|---|---|---|---|---|
| 2025 | $8,349 | $680,940 | $28,350 | $652,590 |
| 2024 | $8,362 | $647,480 | $28,350 | $619,130 |
| 2023 | $6,753 | $542,170 | $28,350 | $513,820 |
| 2022 | $8,370 | $535,720 | $28,350 | $507,370 |
| 2021 | $9,298 | $533,700 | $28,350 | $505,350 |
| 2020 | $7,835 | $585,570 | $28,350 | $557,220 |
| 2019 | $8,705 | $459,830 | $28,350 | $557,220 |
| 2018 | $8,128 | $418,030 | $28,350 | $389,680 |
| 2017 | $7,796 | $400,980 | $28,350 | $372,630 |
| 2016 | $8,277 | $432,920 | $28,350 | $414,120 |
| 2015 | -- | $393,560 | $28,350 | $414,330 |
| 2014 | -- | $388,860 | $28,350 | $360,510 |
Source: Public Records
Map
Nearby Homes
- 2109 Western Dr
- 2202 Western Dr
- 2105 Oaklawn Dr
- 1602 Winfield Rd
- 2016 Gulf Prairie Ln
- 1611 W Pecan Ave
- 1606 Shell Ave
- 1209 W Pecan Ave
- 1210 W Scharbauer Dr
- 1202 W Scharbauer Dr
- 1605 Shell Ave
- 1200 W Scharbauer Dr
- 1607 Shell Ave
- 2000 Neely Ave
- 2704 N L St
- 1805 N D St
- 2609 Mcclintic St
- 907 Shirley Ct
- TBD Bonham St
- 1000 Sinclair Ave