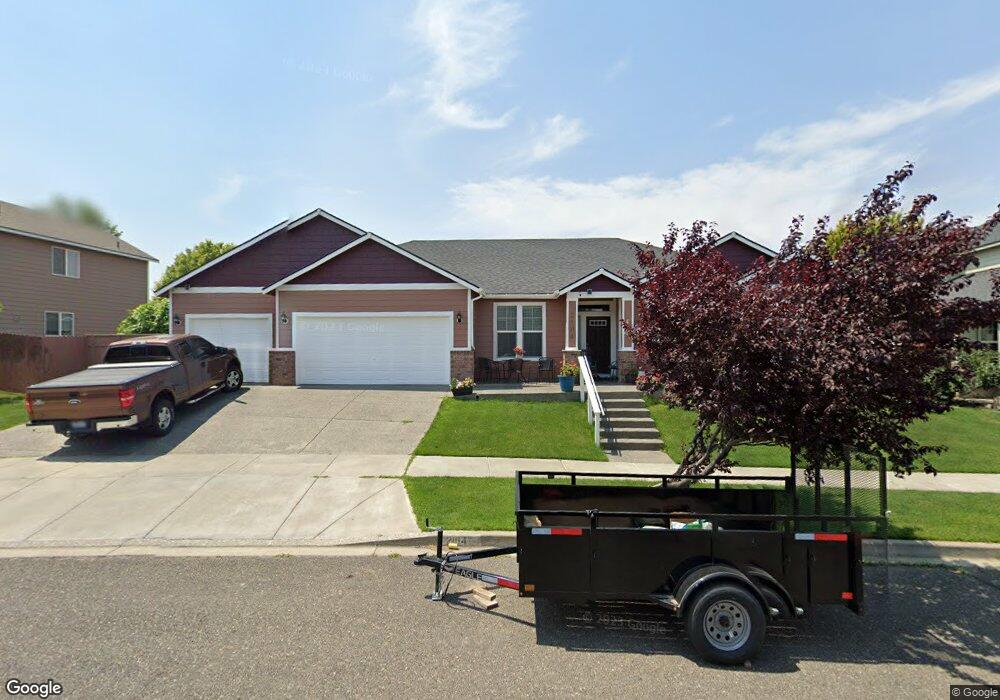
2104 S Reed St Unit HARD TO FIND 4 BD RA Kennewick, WA 99338
Estimated Value: $526,639 - $570,000
4
Beds
3
Baths
2,374
Sq Ft
$228/Sq Ft
Est. Value
About This Home
This home is located at 2104 S Reed St Unit HARD TO FIND 4 BD RA, Kennewick, WA 99338 and is currently estimated at $542,160, approximately $228 per square foot. 2104 S Reed St Unit HARD TO FIND 4 BD RA is a home located in Benton County with nearby schools including Lincoln Elementary School, Southridge High School, and Bethlehem Lutheran School.
Ownership History
Date
Name
Owned For
Owner Type
Purchase Details
Closed on
Jun 6, 2018
Sold by
Pratt Dean A and Pratt Karen L
Bought by
Beric Ibro and Beric Senada
Current Estimated Value
Home Financials for this Owner
Home Financials are based on the most recent Mortgage that was taken out on this home.
Original Mortgage
$255,000
Outstanding Balance
$220,532
Interest Rate
4.5%
Mortgage Type
New Conventional
Estimated Equity
$321,628
Purchase Details
Closed on
Jun 3, 2016
Sold by
Deaton Yevonne C and Palay Christian Matthew
Bought by
The D & K Pratt Trust
Purchase Details
Closed on
Sep 29, 2008
Sold by
Jls Custom Homes Inc
Bought by
Deaton Yevonne C
Home Financials for this Owner
Home Financials are based on the most recent Mortgage that was taken out on this home.
Original Mortgage
$224,808
Interest Rate
6.49%
Mortgage Type
FHA
Create a Home Valuation Report for This Property
The Home Valuation Report is an in-depth analysis detailing your home's value as well as a comparison with similar homes in the area
Home Values in the Area
Average Home Value in this Area
Purchase History
| Date | Buyer | Sale Price | Title Company |
|---|---|---|---|
| Beric Ibro | $407,190 | Stewart Title Co | |
| The D & K Pratt Trust | $248,500 | Cascade Title Company | |
| Deaton Yevonne C | $228,900 | Chicago Title |
Source: Public Records
Mortgage History
| Date | Status | Borrower | Loan Amount |
|---|---|---|---|
| Open | Beric Ibro | $255,000 | |
| Previous Owner | Deaton Yevonne C | $224,808 |
Source: Public Records
Tax History Compared to Growth
Tax History
| Year | Tax Paid | Tax Assessment Tax Assessment Total Assessment is a certain percentage of the fair market value that is determined by local assessors to be the total taxable value of land and additions on the property. | Land | Improvement |
|---|---|---|---|---|
| 2024 | $4,074 | $538,000 | $70,000 | $468,000 |
| 2023 | $4,074 | $511,260 | $70,000 | $441,260 |
| 2022 | $3,423 | $390,920 | $70,000 | $320,920 |
| 2021 | $3,525 | $350,800 | $70,000 | $280,800 |
| 2020 | $3,469 | $350,540 | $42,000 | $308,540 |
| 2019 | $2,972 | $329,970 | $42,000 | $287,970 |
| 2018 | $3,116 | $288,830 | $42,000 | $246,830 |
| 2017 | $2,863 | $247,690 | $42,000 | $205,690 |
| 2016 | $3,304 | $247,690 | $42,000 | $205,690 |
| 2015 | $3,296 | $247,690 | $42,000 | $205,690 |
| 2014 | -- | $245,970 | $42,000 | $203,970 |
| 2013 | -- | $245,970 | $42,000 | $203,970 |
Source: Public Records
Map
Nearby Homes
- Lot 18, Phase 8 W 21st Ave Unit Lot18
- Lot 16, Phase 8 W 21st Ave Unit Lot16
- Lot 19, Phase 8 W 21st Ave Unit Lot19
- Lot 20, Phase 8 W 21st Ave Unit Lot20
- 2015 S Sheppard St
- 6910 W 22nd Ave
- 2017 S Sheppard Place
- 2017 S Tweedt St
- 3701 W 20th Ave
- 4311 W 22nd Ave
- 4218 W 19th Ave
- 4175 W 24th Ave
- 1839 S Union St
- 1821 S Union St
- 1513 S Reed Ct
- 2602 S Union St
- 2606 S Williams Place
- 2401 S Arthur Ct
- 2451 S Arthur Ct
- 6449 W 29th Ct
- 2104 S Reed St Unit Spacious Rambler! Ch
- 2104 S Reed St Unit Spacious 4 bedroom r
- 2104 S Reed St Unit Desirable Cherry Blo
- 2104 S Reed St
- 2106 S Reed St
- 2102 S Reed St
- 2103 S Sheppard St
- 2101 S Sheppard St
- 2103 S Reed St
- 2110 S Reed St
- Lot 9 Ph 5E W 21st Ave
- Lot 7 Ph 5E W 21st Ave
- Lot 6 Ph 5E W 21st Ave
- Lot 8 Ph 5E W 21st Ave
- 2101 S Reed St
- 2105 S Reed St
- 2016 S Reed St
- 2109 S Reed St
- 2109 S Sheppard St
- 2019 S Sheppard St