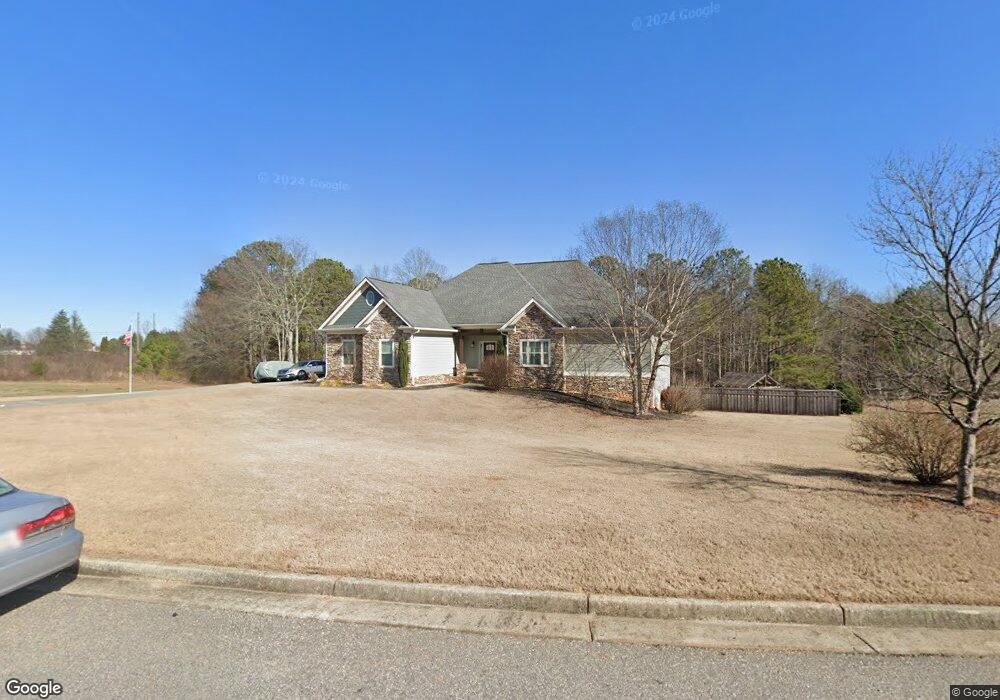
2104 Stonegate Way Monroe, GA 30656
Estimated Value: $646,000 - $782,000
--
Bed
1
Bath
2,693
Sq Ft
$269/Sq Ft
Est. Value
About This Home
This home is located at 2104 Stonegate Way, Monroe, GA 30656 and is currently estimated at $724,823, approximately $269 per square foot. 2104 Stonegate Way is a home with nearby schools including Walker Park Elementary School, Carver Middle School, and Monroe Area High School.
Ownership History
Date
Name
Owned For
Owner Type
Purchase Details
Closed on
Apr 10, 2020
Sold by
Rankin John A
Bought by
Cain Amanda L
Current Estimated Value
Home Financials for this Owner
Home Financials are based on the most recent Mortgage that was taken out on this home.
Original Mortgage
$314,407
Outstanding Balance
$275,662
Interest Rate
2.87%
Mortgage Type
FHA
Estimated Equity
$449,161
Purchase Details
Closed on
Jun 8, 2017
Sold by
Rankin John A
Bought by
Rankin John A and Cain Amanda L
Purchase Details
Closed on
Nov 15, 2013
Sold by
Rocky Branch Builders Llc
Bought by
Rankin John A
Home Financials for this Owner
Home Financials are based on the most recent Mortgage that was taken out on this home.
Original Mortgage
$263,145
Interest Rate
3.87%
Mortgage Type
FHA
Purchase Details
Closed on
May 21, 2013
Sold by
The Brand Banking Co
Bought by
Rocky Branch Builders Llc
Create a Home Valuation Report for This Property
The Home Valuation Report is an in-depth analysis detailing your home's value as well as a comparison with similar homes in the area
Home Values in the Area
Average Home Value in this Area
Purchase History
| Date | Buyer | Sale Price | Title Company |
|---|---|---|---|
| Cain Amanda L | -- | -- | |
| Rankin John A | -- | -- | |
| Rankin John A | $276,845 | -- | |
| Rocky Branch Builders Llc | $28,000 | -- |
Source: Public Records
Mortgage History
| Date | Status | Borrower | Loan Amount |
|---|---|---|---|
| Open | Cain Amanda L | $314,407 | |
| Previous Owner | Rankin John A | $263,145 |
Source: Public Records
Tax History Compared to Growth
Tax History
| Year | Tax Paid | Tax Assessment Tax Assessment Total Assessment is a certain percentage of the fair market value that is determined by local assessors to be the total taxable value of land and additions on the property. | Land | Improvement |
|---|---|---|---|---|
| 2024 | $5,824 | $252,120 | $50,000 | $202,120 |
| 2023 | $5,634 | $227,880 | $50,000 | $177,880 |
| 2022 | $4,777 | $177,800 | $26,400 | $151,400 |
| 2021 | $3,950 | $130,000 | $22,000 | $108,000 |
| 2020 | $4,050 | $130,000 | $22,000 | $108,000 |
| 2019 | $4,000 | $130,000 | $22,000 | $108,000 |
| 2018 | $4,039 | $130,000 | $22,000 | $108,000 |
| 2017 | $4,694 | $136,240 | $22,000 | $114,240 |
| 2016 | $3,794 | $115,440 | $22,000 | $93,440 |
| 2015 | $3,756 | $111,000 | $22,000 | $89,000 |
| 2014 | $3,784 | $108,160 | $0 | $0 |
Source: Public Records
Map
Nearby Homes
- (GA)The Cooper | Side Entry Plan at Stonegate
- Riley A.2 3 Side Entry Plan at Stonegate
- (GA)The Kirkland | Side Entry Plan at Stonegate
- (GA)Woodmont A.1 3 Side Entry Plan at Stonegate
- (GA)The Woodmont | Side Entry Plan at Stonegate
- The Riley | Side Entry Plan at Stonegate
- 2316 Pebble Trail
- 2321 Pebble Trail
- 436 James Powers Rd
- 2133 Stonegate Way
- 3055 Spring Hill Dr
- 3055A Spring Hill Dr
- 1252 White Columns Dr
- 2853 Brookside Dr
- 0 Nicholsville Rd Unit 10390907
- 2790 Fannie Thompson Rd NW
- 1101 Longleaf Trace
- 1074 Pine View Trail
- 3084 George Williams Rd
- 3589 Fannie Thompson Rd NW
- 0 Stonegate Way Unit 21 2831094
- 0 Stonegate Way Unit 15 2831089
- 0 Stonegate Way Unit 10 2831085
- 0 Stonegate Way Unit 6 2831081
- 0 Stonegate Way Unit 2 2831074
- 10 Stonegate Way
- 2 Stonegate Way
- 15 Stonegate Way
- 21 Stonegate Way
- 6 Stonegate Way
- 2930 Bold Springs Rd NW
- 2950 Bold Springs Rd
- 2109 Stonegate Way
- 2105 Stonegate Way
- 2101 Stonegate Way
- 2113 Stonegate Way
- 2112 Stonegate Way
- 501 San Dra Way
- 2304 Pebble Trail
- 2305 Pebble Trail