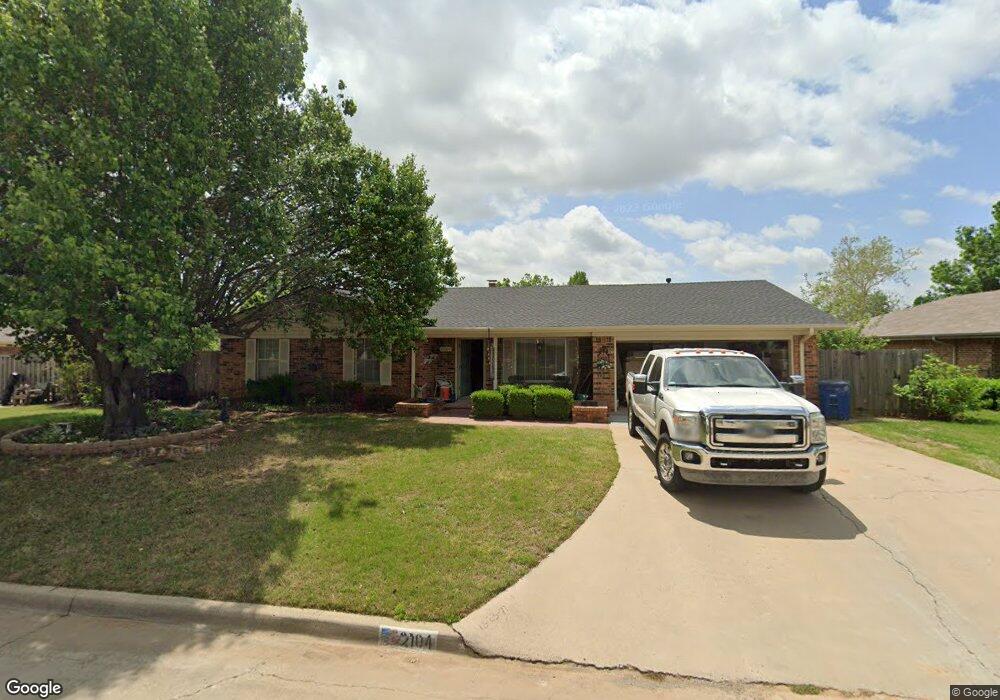
2104 W Scott Ln Duncan, OK 73533
Estimated Value: $169,000 - $215,000
3
Beds
2
Baths
1,674
Sq Ft
$109/Sq Ft
Est. Value
About This Home
This home is located at 2104 W Scott Ln, Duncan, OK 73533 and is currently estimated at $182,009, approximately $108 per square foot. 2104 W Scott Ln is a home located in Stephens County with nearby schools including Horace Mann Elementary School, Duncan Middle School, and Duncan High School.
Ownership History
Date
Name
Owned For
Owner Type
Purchase Details
Closed on
Jun 4, 2015
Sold by
King Ronnie and King Sue
Bought by
Sevier Randell Wayne and Sevier Debra K
Current Estimated Value
Home Financials for this Owner
Home Financials are based on the most recent Mortgage that was taken out on this home.
Original Mortgage
$132,453
Outstanding Balance
$102,037
Interest Rate
3.68%
Mortgage Type
FHA
Estimated Equity
$79,972
Purchase Details
Closed on
Apr 9, 2012
Sold by
Weber Robert D and Weber Patricia A
Bought by
King Ronnie and King Sue
Purchase Details
Closed on
Jul 27, 2011
Sold by
Davis Danny D
Bought by
Weber Robert D and Weber Patricia A
Home Financials for this Owner
Home Financials are based on the most recent Mortgage that was taken out on this home.
Original Mortgage
$129,000
Interest Rate
4.53%
Mortgage Type
VA
Purchase Details
Closed on
Sep 20, 2002
Sold by
Howell Arnold L and Howell Hyllis
Create a Home Valuation Report for This Property
The Home Valuation Report is an in-depth analysis detailing your home's value as well as a comparison with similar homes in the area
Home Values in the Area
Average Home Value in this Area
Purchase History
| Date | Buyer | Sale Price | Title Company |
|---|---|---|---|
| Sevier Randell Wayne | $133,500 | None Available | |
| King Ronnie | $130,500 | None Available | |
| Weber Robert D | -- | None Available | |
| -- | $79,500 | -- |
Source: Public Records
Mortgage History
| Date | Status | Borrower | Loan Amount |
|---|---|---|---|
| Open | Sevier Randell Wayne | $132,453 | |
| Previous Owner | Weber Robert D | $129,000 |
Source: Public Records
Tax History Compared to Growth
Tax History
| Year | Tax Paid | Tax Assessment Tax Assessment Total Assessment is a certain percentage of the fair market value that is determined by local assessors to be the total taxable value of land and additions on the property. | Land | Improvement |
|---|---|---|---|---|
| 2025 | $1,166 | $13,816 | $1,125 | $12,691 |
| 2024 | $1,121 | $13,159 | $1,125 | $12,034 |
| 2023 | $1,121 | $13,159 | $1,125 | $12,034 |
| 2022 | $1,015 | $12,532 | $1,125 | $11,407 |
| 2021 | $968 | $11,367 | $1,125 | $10,242 |
| 2020 | $994 | $11,512 | $1,125 | $10,387 |
| 2019 | $992 | $11,469 | $1,125 | $10,344 |
| 2018 | $1,093 | $12,268 | $1,125 | $11,143 |
| 2017 | $1,259 | $14,649 | $1,125 | $13,524 |
| 2016 | $1,258 | $14,797 | $1,125 | $13,672 |
| 2015 | $1,160 | $13,834 | $1,125 | $12,709 |
| 2014 | $1,160 | $13,834 | $1,125 | $12,709 |
Source: Public Records
Map
Nearby Homes
- 1212 N 21st St
- 1309 Whisenant Ct
- 1902 W Randall Ave
- 1807 W Chisholm Dr
- 1099 N 19th St
- 2204 W Parkview Ave
- 2202 W Canary Ave
- 2206 W Spruce Ave
- 2120 Flamingo Ln
- 2203 Canary Ave
- 2210 Western Dr
- 2129 W Mallard Dr
- 507 N Alice Dr
- 1405 Evergreen Dr
- 2201 Mallard
- 1404 Aspen Ave
- 815 N 14th St
- 2360 Rockwell Dr
- 2321 Rockwell Dr
- 2407 W Mallard Dr
- 2106 W Scott Ln
- 1215 N 21st St
- 2103 W Amhurst Ave
- 2105 W Amhurst Ave
- 2101 W Amhurst Ave
- 2108 W Scott Ln
- 2103 W Scott Ln
- 2107 W Amhurst Ave
- 1305 N 21st St
- 2105 W Scott Ln
- 2110 W Scott Ln
- 1214 N 21st St
- 1216 N 21st St
- 2107 W Scott Ln
- 1212 1212 N 21st
- 2102 W Amhurst Ave
- 2109 W Amhurst Ave
- 179381 N 3000 Rd
- 289298 E 1790 Rd
- 296161 E 1790 Rd