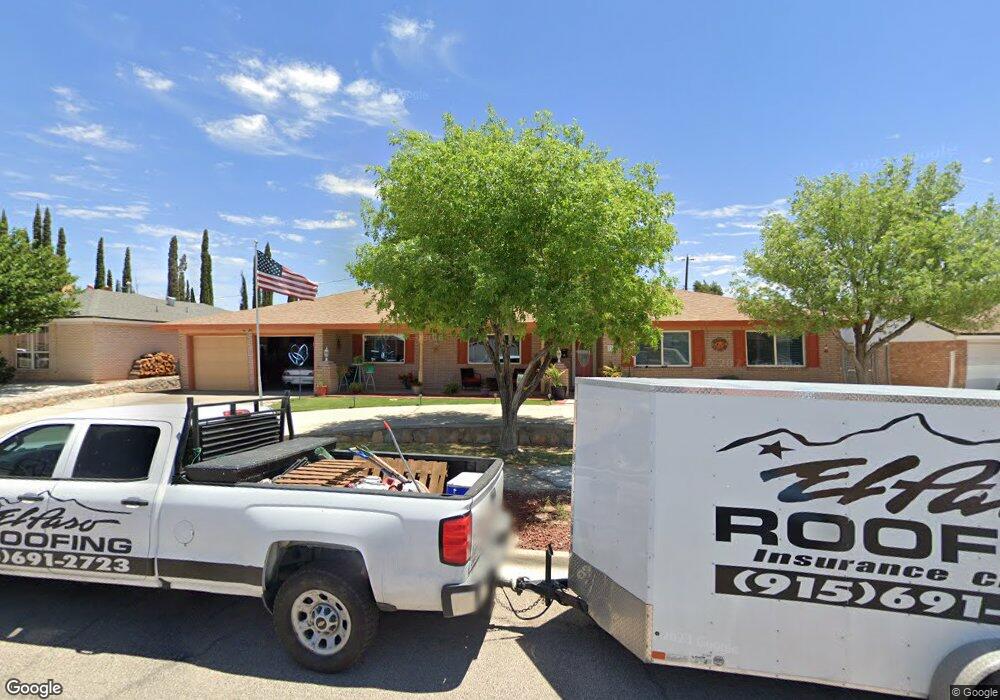
2104 Windrock St El Paso, TX 79925
Eastwood NeighborhoodEstimated Value: $313,208 - $370,000
--
Bed
3
Baths
2,670
Sq Ft
$129/Sq Ft
Est. Value
About This Home
This home is located at 2104 Windrock St, El Paso, TX 79925 and is currently estimated at $344,052, approximately $128 per square foot. 2104 Windrock St is a home located in El Paso County with nearby schools including East Point Elementary School, Eastwood Middle School, and Eastwood High School.
Ownership History
Date
Name
Owned For
Owner Type
Purchase Details
Closed on
Mar 13, 2000
Sold by
Delossantos Dalia
Bought by
Farley Ii Quincy D and Flores Farley Christine
Current Estimated Value
Home Financials for this Owner
Home Financials are based on the most recent Mortgage that was taken out on this home.
Original Mortgage
$102,600
Outstanding Balance
$34,622
Interest Rate
8.23%
Estimated Equity
$309,430
Purchase Details
Closed on
Feb 4, 1997
Sold by
Dorgan Joseph H and Dorgan Lucinda M
Bought by
Flores Henry and Delossantos Dalia
Home Financials for this Owner
Home Financials are based on the most recent Mortgage that was taken out on this home.
Original Mortgage
$107,900
Interest Rate
8.23%
Create a Home Valuation Report for This Property
The Home Valuation Report is an in-depth analysis detailing your home's value as well as a comparison with similar homes in the area
Home Values in the Area
Average Home Value in this Area
Purchase History
| Date | Buyer | Sale Price | Title Company |
|---|---|---|---|
| Farley Ii Quincy D | -- | -- | |
| Flores Henry | -- | -- |
Source: Public Records
Mortgage History
| Date | Status | Borrower | Loan Amount |
|---|---|---|---|
| Open | Farley Ii Quincy D | $102,600 | |
| Previous Owner | Flores Henry | $107,900 |
Source: Public Records
Tax History Compared to Growth
Tax History
| Year | Tax Paid | Tax Assessment Tax Assessment Total Assessment is a certain percentage of the fair market value that is determined by local assessors to be the total taxable value of land and additions on the property. | Land | Improvement |
|---|---|---|---|---|
| 2025 | $4,322 | $304,105 | -- | -- |
| 2024 | $4,322 | $276,459 | -- | -- |
| 2023 | $4,235 | $251,326 | $0 | $0 |
| 2022 | $7,095 | $228,478 | $0 | $0 |
| 2021 | $6,752 | $207,707 | $39,092 | $168,615 |
| 2020 | $7,136 | $225,933 | $30,071 | $195,862 |
| 2018 | $7,027 | $225,972 | $30,071 | $195,901 |
| 2017 | $6,507 | $212,869 | $30,071 | $182,798 |
| 2016 | $6,507 | $212,869 | $30,071 | $182,798 |
| 2015 | $5,186 | $212,869 | $30,071 | $182,798 |
| 2014 | $5,186 | $210,395 | $30,071 | $180,324 |
Source: Public Records
Map
Nearby Homes
- 10145 Camwood Dr
- 9917 Honolulu Dr
- 10233 Byway Dr
- 9801 Eastridge Dr
- 10304 Woodruff Ct
- 10313 Byway Dr
- 10309 Woodruff Ct
- 10463 Davwood Ln
- 10401 Springwood Dr
- 10145 Singapore Ave
- 10212 Garwood Ct
- 2425 Fir St
- 9674 Stonehaven Dr
- 10140 Suez Dr
- 10533 Springwood Dr
- 10412 Chinaberry Dr
- 9525 Desert Ridge Dr
- 2412 Penwood Dr
- 9605 Montwood Dr
- 1909 Crow Dr
- 2108 Windrock Dr
- 2100 Windrock St
- 2109 Whitcomb St
- 2101 Whitcomb St
- 2105 Whitcomb St
- 2105 Whitcomb St Unit 1
- 2112 Windrock St
- 2112 Windrock Dr
- 2105 Windrock St
- 2109 Windrock St
- 2101 Windrock St
- 2113 Whitcomb St
- 2113 Windrock St
- 2116 Windrock St
- 2117 Whitcomb St
- 2104 Whitcomb St
- 2108 Whitcomb St
- 10124 Montwood Dr
- 2100 Whitcomb St
- 10128 Montwood Dr