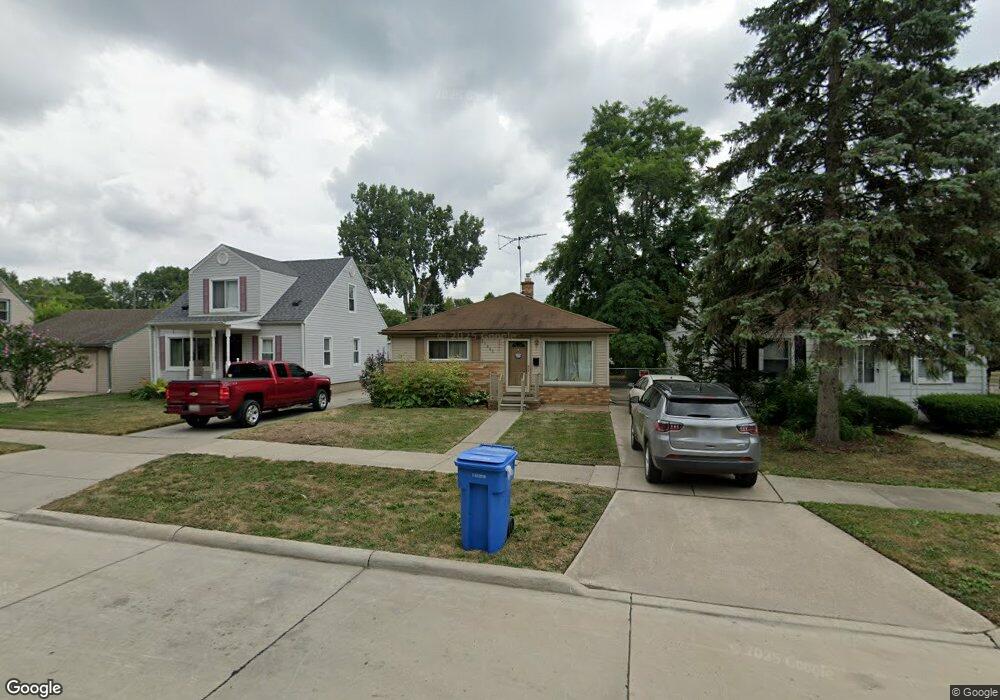
21045 Powers Ave Dearborn Heights, MI 48125
Estimated Value: $135,000 - $151,000
3
Beds
1
Bath
980
Sq Ft
$147/Sq Ft
Est. Value
About This Home
This home is located at 21045 Powers Ave, Dearborn Heights, MI 48125 and is currently estimated at $143,938, approximately $146 per square foot. 21045 Powers Ave is a home located in Wayne County with nearby schools including Polk Elementary School, Bedford School, and Pardee School.
Ownership History
Date
Name
Owned For
Owner Type
Purchase Details
Closed on
Mar 13, 2024
Sold by
Declaration Of Trust For Laurel A Steven and Stevens Laurel A
Bought by
Ksj-Llc
Current Estimated Value
Purchase Details
Closed on
Oct 1, 2018
Sold by
Quigg Francis P
Bought by
Stevens Laurel A
Purchase Details
Closed on
Sep 25, 2018
Sold by
Quigg Francis P
Bought by
Laurel A Stevens Trust
Purchase Details
Closed on
Apr 4, 2016
Sold by
Jackson Colleen M and Bohlen Colleen M
Bought by
Charlies Properties Llc
Purchase Details
Closed on
Mar 31, 2016
Sold by
Jackson Colleen M and Jackson Lawrence H
Bought by
Quigg Francis and Charles Properties
Purchase Details
Closed on
May 16, 2006
Sold by
Toler David R and Toler Rachel M
Bought by
Jackson Colleen M
Purchase Details
Closed on
Nov 25, 1997
Sold by
Mouro Deborah L and Mouro Joel J
Bought by
Skrobe Susan L
Create a Home Valuation Report for This Property
The Home Valuation Report is an in-depth analysis detailing your home's value as well as a comparison with similar homes in the area
Home Values in the Area
Average Home Value in this Area
Purchase History
| Date | Buyer | Sale Price | Title Company |
|---|---|---|---|
| Ksj-Llc | $675,000 | Title One | |
| Ksj-Llc | $675,000 | Title One | |
| Stevens Laurel A | -- | None Available | |
| Quigg Francis P | -- | None Available | |
| Laurel A Stevens Trust | $68,741 | None Available | |
| Charlies Properties Llc | $1,000 | None Available | |
| Bohlen Colleen M | -- | None Available | |
| Quigg Francis | $33,971 | Attorney | |
| Jackson Colleen M | $94,900 | Multiple | |
| Skrobe Susan L | $70,100 | -- |
Source: Public Records
Tax History Compared to Growth
Tax History
| Year | Tax Paid | Tax Assessment Tax Assessment Total Assessment is a certain percentage of the fair market value that is determined by local assessors to be the total taxable value of land and additions on the property. | Land | Improvement |
|---|---|---|---|---|
| 2025 | $1,590 | $58,400 | $0 | $0 |
| 2024 | $1,590 | $52,200 | $0 | $0 |
| 2023 | $1,505 | $45,900 | $0 | $0 |
| 2022 | $2,241 | $39,500 | $0 | $0 |
| 2021 | $2,224 | $34,200 | $0 | $0 |
| 2019 | $2,146 | $29,300 | $0 | $0 |
| 2018 | $1,107 | $24,100 | $0 | $0 |
| 2017 | $1,221 | $23,000 | $0 | $0 |
| 2016 | $1,168 | $22,500 | $0 | $0 |
| 2015 | $2,090 | $20,900 | $0 | $0 |
| 2013 | $2,110 | $22,300 | $0 | $0 |
| 2010 | -- | $27,300 | $0 | $0 |
Source: Public Records
Map
Nearby Homes
- 21302 Powers Ave
- 4913 Campbell St
- 5381 Merrick St
- 21334 Powers Ave
- 5621 Merrick St
- 4644 Gertrude St
- 5648 Hipp St
- 5660 Hipp St
- 5373 Katherine St
- Vacant Clippert St
- 5873 Merrick St
- 20425 Powers Ave
- 5614 Katherine St
- 5455 Mayfair St
- 5656 Monroe St
- 4620 Katherine St
- 4507 Katherine St
- 4455 Hipp St
- 5642 Weddel St
- 4679 Mayfair St
- 21033 Powers Ave
- 21057 Powers Ave
- 21017 Powers Ave
- 5345 Gertrude St
- 21101 Powers Ave
- 21040 Powers Ave
- 21001 Powers Ave
- 21028 Powers Ave
- 5330 Gertrude St
- 5332 Harding St
- 21016 Powers Ave
- 5353 Gertrude St
- 21113 Powers Ave
- 21010 Powers Ave
- 5361 Gertrude St
- 5352 Gertrude St
- 21121 Powers Ave
- 5369 Gertrude St
- 21129 Powers Ave
- 5340 Harding St